Analytics page in Jitterbit API Manager
Introduction
The Analytics page within the API Manager allows you to review the consumption and performance metrics for custom APIs, OData services, and proxy APIs. The data is displayed within multiple graphs and correlated charts.
Note
You must have already published an API and executed at least one API request in order to see API analytic data.
For more information on configuring and executing an API, see these resources:
Access the Analytics page
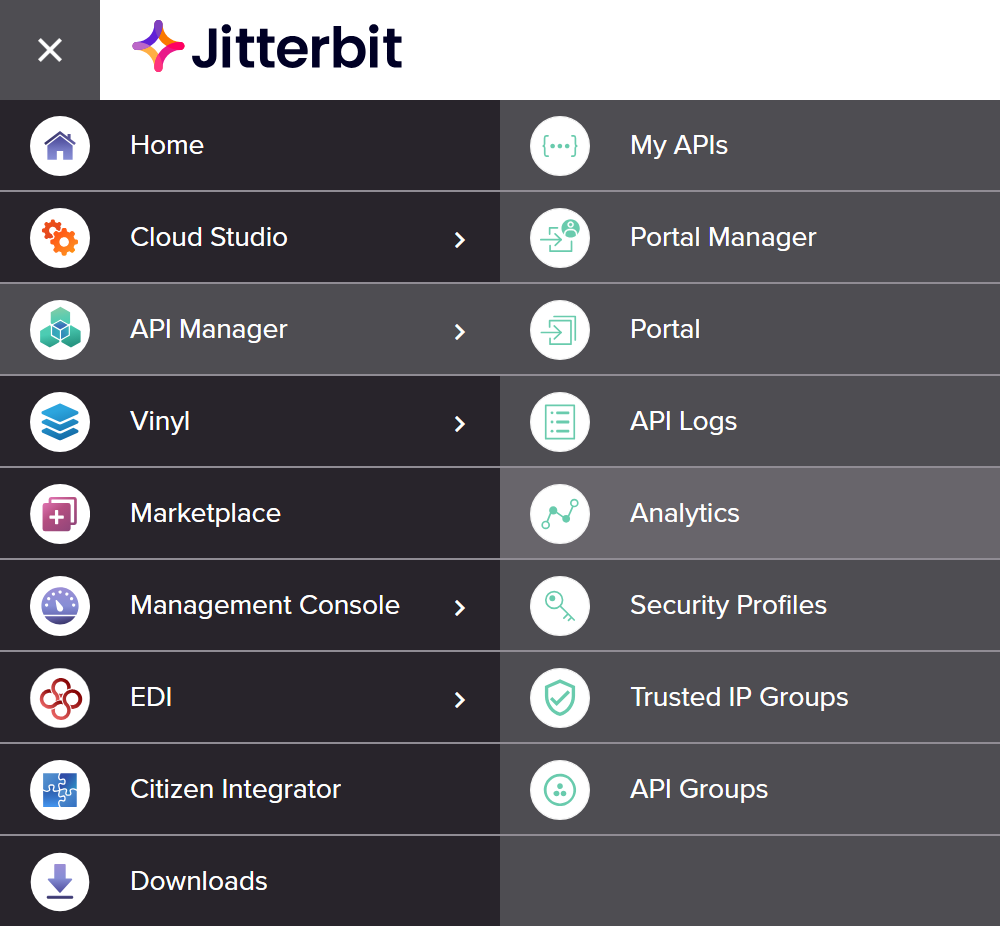
The Analytics page can be accessed from either the Harmony portal menu or the API Manager navigation menu:
-
Use the Harmony portal menu to select API Manager > Analytics:
-
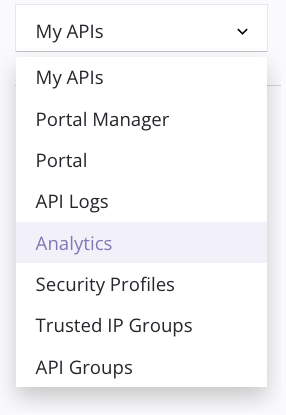
When accessing an API Manager page, use its navigation menu to select Analytics:
Analytics page header
The header along the top of the Analytics page includes the API Manager navigation menu and filters:
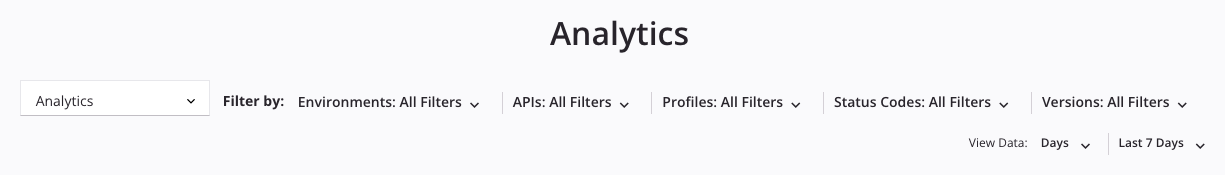
You can adjust the data each graph displays, as well as the time frame and scale of the graph, using the Filter by and View Data dropdowns.
Filter by
The Filter by dropdowns allow you to display specific target criteria across any combination of environments, APIs, profiles, status codes, and versions as needed.
Each filter displays a dropdown list of criteria from which you can select one or multiple criteria.
These are the available criteria to filter by:
-
Environments: Use the dropdown to select environments where the APIs are located. When all filters are unselected, environments for all APIs in the organization to which you have access are displayed.
-
APIs: Use the dropdown to select published APIs within the organization. When all filters are unselected, all APIs in the organization to which you have access are displayed.
Note
Previously published APIs that become unpublished will not appear in the APIs dropdown. API logs for these APIs will be present on the API Logs page, but cannot be filtered.
-
Profiles: Select the security profiles to filter the logs by. The dropdown displays security profiles created within the organization.
-
Status Codes: Use the dropdown to select the HTTP response status code groups, selecting from Success (2xx), Redirections (3xx), Client Errors (4xx), and Server Errors (5xx). When all filters are unselected, all HTTP response status codes for APIs in the organizations to which you have access are displayed. For more information on status codes, see w3.org status code definitions.
-
Versions: Use the dropdown to select the version number of the APIs. When all filters are unselected, all versions of the APIs in the organization to which you have access are displayed.
View Data
The View Data dropdowns allow you to filter the analytics data within a specific period of time:
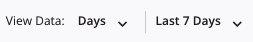
The first dropdown allows you to select the unit of time. Select one of Days, Hours, Minutes, or Seconds. The default setting for the unit of time is Days.
The second dropdown allows you to select the period of time. Select one of Last 10 Minutes, Last 1 Hour, Last 10 Hours, Last 24 Hours, Last 7 Days, Last 1 Month, or Custom Period. The default setting for the period of time is Last 7 Days.
Note
It is best to select the period of time first and then select the unit of time. The unit of time will dynamically change depending on the selected period of time.
Selecting Custom Period allows you to filter the traffic by a specified time period. When this option is selected, additional From and To calendar fields display:

- From: Click to adjust the starting date and time for the analytics data.
- To: Click to adjust the ending date and time for the analytics data.
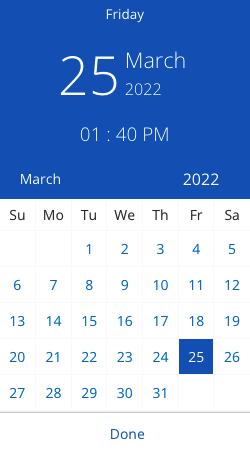
After clicking the From or To calendar fields, a calendar dialog is displayed where you select the date and time:
Additional options
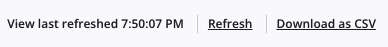
Additional options display directly above the first graph:
-
View last refreshed: Displays the last time the data was refreshed either dynamically or manually. The time is displayed in the format
h:mm:ss. -
Refresh: Click to refresh the analytics data based on the applied filters and search criteria.
-
Download as CSV: Click to download the current analytics data based on the applied filters and search criteria.
Note
The date field within the CSV file is a UNIX timestamp that will require conversion if you want to use a different date and time format.
Hits
The Hits graph displays the number of API hits per the selected unit of time across the selected period of time. In this example, the unit of time is Days and the period of time is Last 1 Month:
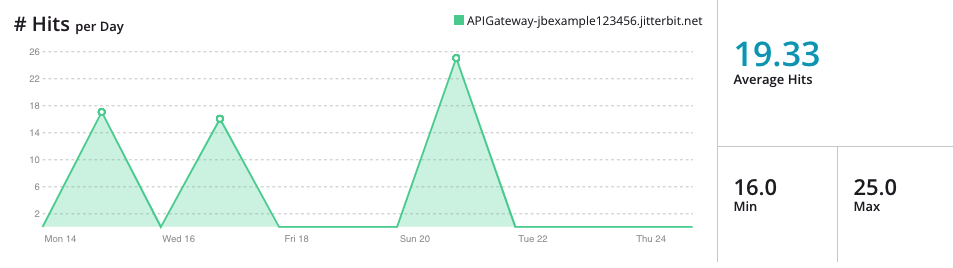
The API hits are graphed as three sets of data: average, minimum, and maximum values. Each set is used for the summary calculations displayed in the chart to the right of the graph.
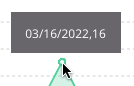
Hover over any data point to display the metrics:
You can download the data displayed within the graph to a CSV file. For more information, see Additional options above.
Response Times
The Response Times graph displays the response times in milliseconds for the API(s) per the selected unit of time across the selected period of time. In this example, the unit of time is Days and the period of time is Last 1 Month:
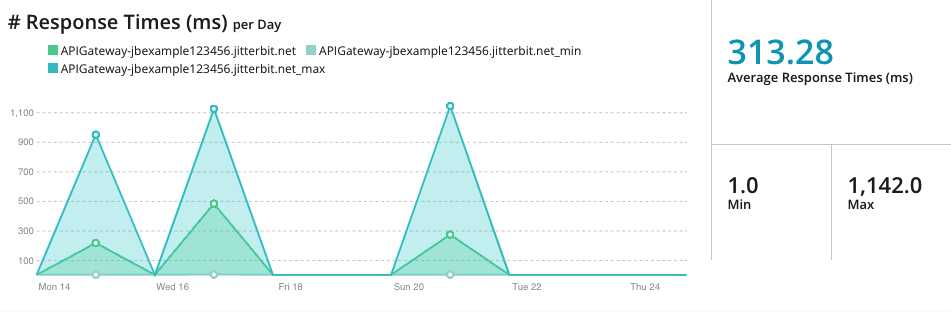
The API response times are graphed as three sets of data: average, minimum, and maximum values. Each set is used for the summary calculations displayed in the chart to the right of the graph.
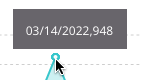
Hover over any data point to display the metrics:
You can download the data displayed within the graph to a CSV file. For more information, see Additional options above.
Status Code
The Status Code graph displays the API status codes per the selected unit of time across the selected period of time. In this example, the unit of time is Days and the period of time is Last 1 Month:
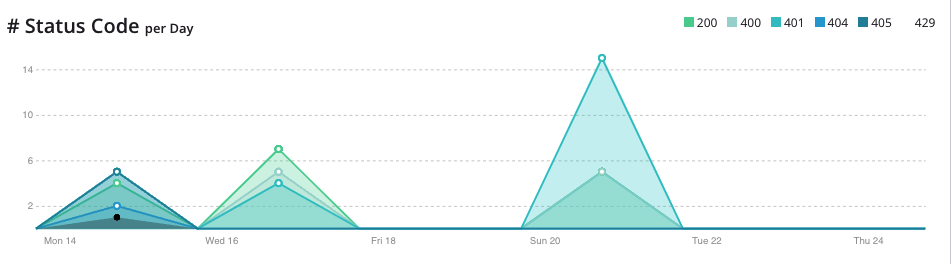
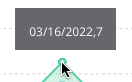
Hover over any data point to display the metrics:
You can download the data displayed within the graph to a CSV file. For more information, see Additional options above.
API Health Monitoring
The API Health Monitoring table shows a list of slow-running or active custom API calls (occurring within a set timeframe) and their response times:
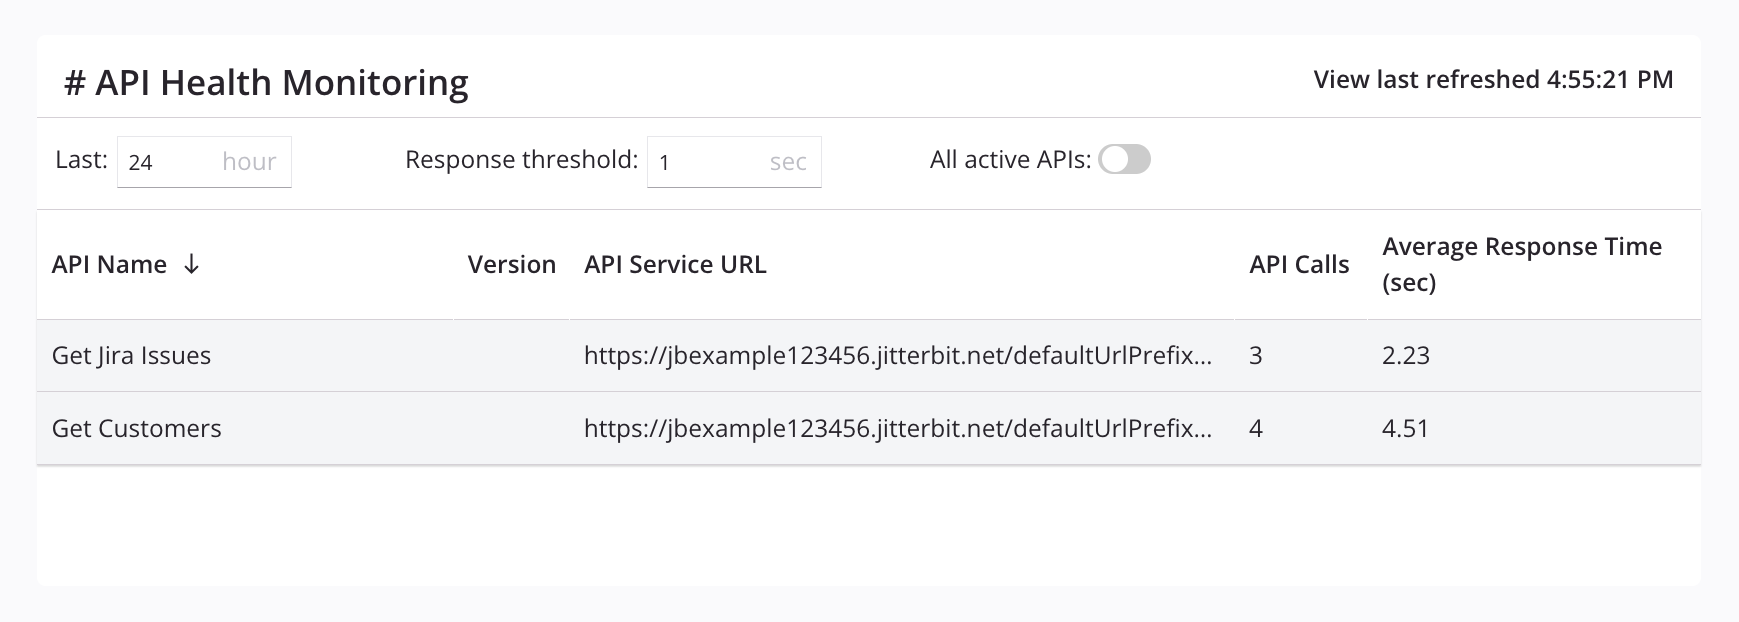
-
Response threshold: Enter the response threshold (in seconds) to display custom API calls with a response time equal to or greater than the provided threshold. The default value is
5seconds and the minimum value allowed is1second. The number provided must be an integer. -
All active APIs: Click to toggle the table between showing only custom APIs whose Response Time is equal to or greater than the provided Response threshold (toggled off) or showing all active custom APIs (toggled on) within the provided timeframe. When toggled on, the Response threshold field is disabled.
-
Download: Downloads a CSV file of the current table data based on the applied filters. -
API name: The custom API name. To change the sort order from descending (default) to ascending, click the arrows next to the column name.
-
Version: The version of the custom API (if provided).
-
Service name: The name of the API service.
-
Method: The request method of the API service.
-
API service URL: The API service URL.
-
API calls: The total number of calls to the custom API within the provided timeframe.
-
Average response time (sec): The average response time (in seconds) for the custom API call.
Consumption chart
The consumption chart displays the top 10 consumption metrics within the selected period:
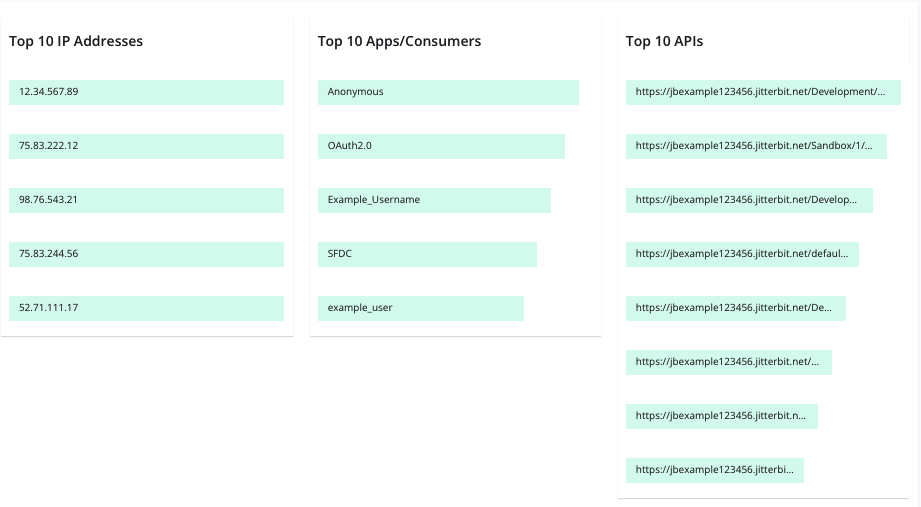
- Top 10 IP Addresses: The top 10 IP addresses accessing the APIs created within API Manager.
- Top 10 Apps or Consumers: The top 10 consumers accessing the APIs created within API Manager.
- Top 10 APIs: The top 10 APIs being consumed by the IP addresses and API consumers.