API logs
Introduction
The API Logs page within API Manager displays a table of all API processing logs as well as debug logs (if debug logging is enabled). Logs display for custom, OData, and proxy APIs when they are called through the cloud API gateway or private API gateway.
There are four types of logs that can be recorded for an API call:
- API Logs: API logs are automatically generated on the API Logs page for each API Manager API call. API logs contain information about the API call, including the timestamp of the API request, the HTTP status code, the request ID, the request method, the request URI, the response time, the source IP of the calling application, the source application, and any log messages.
- API Debug Logs: API debug logs are additional entries in an existing API log that fully trace every request received through an API Manager API's service URL. API debug logging is not enabled by default and must be enabled on an individual API Manager API for API debug logs to be included in an API log.
- API Verbose Logs: API verbose logs are additional entries in an existing API log that consist of request and response data received or sent through an API Manager API's service URL. API verbose logging is not enabled by default and must be enabled on an individual API Manager API for API verbose logs to be included in an API log.
- API Operation Logs: API operation logs contain the start of an API call and the time elapsed. Unlike API logs, debug logs, and verbose logs, API operation logs require the use of a private agent and are enabled in the private agent configuration file. These logs are recorded on the private agent in the
jitterbit.logfile located in thelogdirectory.
Logging data for API logs, debug logs, and verbose logs is available on the API Logs page for 90 days from the date the API is consumed.
For more information on enabling debug logs and verbose logs, see these resources:
- Step 1: Settings of custom API configuration
- Step 1: Settings of OData service configuration
- Step 1: Basic settings of proxy API configuration
To add additional log information for OData APIs, including SQL data sent to the database, edit the private agent configuration file and set DebugJDML to true.
Access the API Logs page
The API Logs page can be accessed from the Harmony portal menu, or from other pages within API Manager:
-
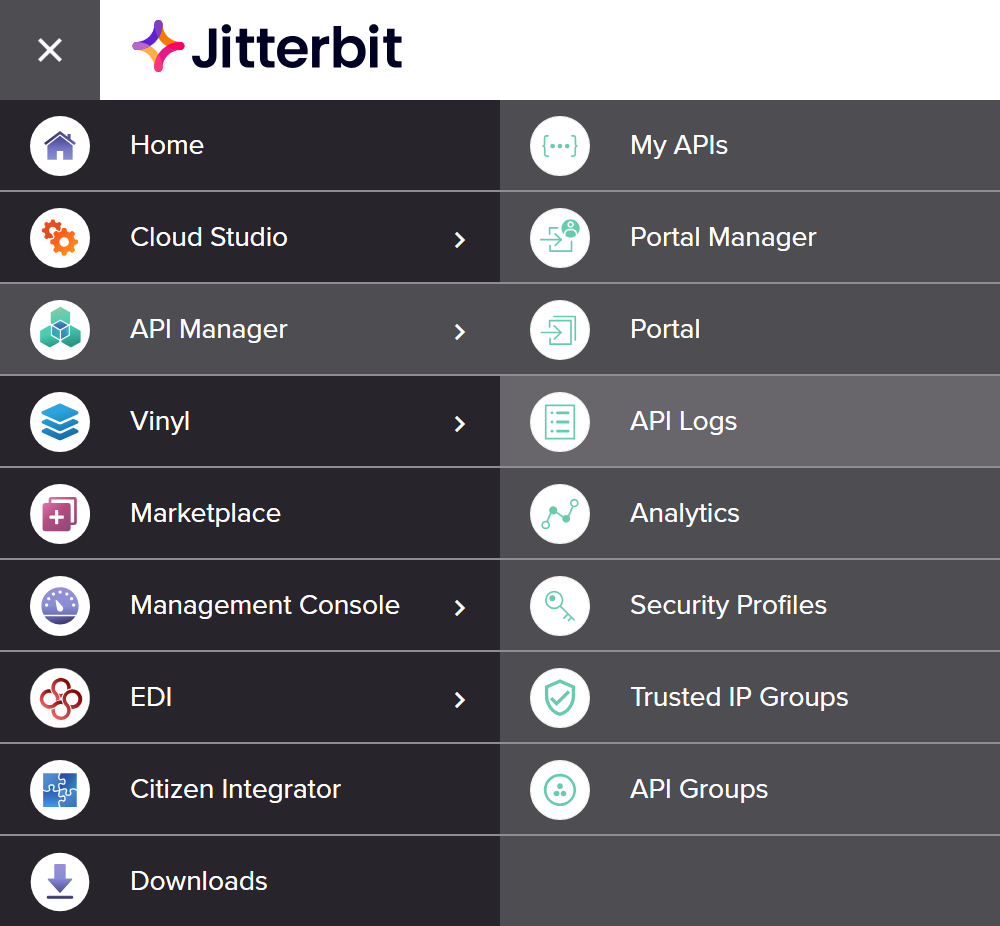
From the Home or Downloads pages, or from the Cloud Studio, Vinyl, Marketplace, Management Console, EDI, or Citizen Integrator applications, use the Harmony portal menu in the top left to go to API Manager > API Logs:
-
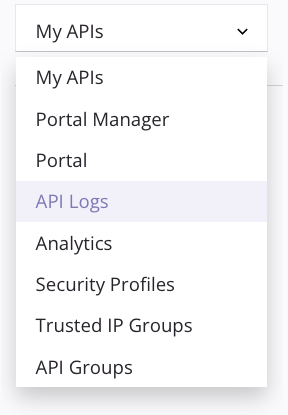
From the My APIs, Portal Manager, Analytics, Security Profiles, Trusted IP Groups, or API Groups pages, use the API Manager navigation menu to select API Logs:
API Logs page header
The header along the top of the API Logs page includes the API Manager navigation menu, a search bar, filters, and additional options:
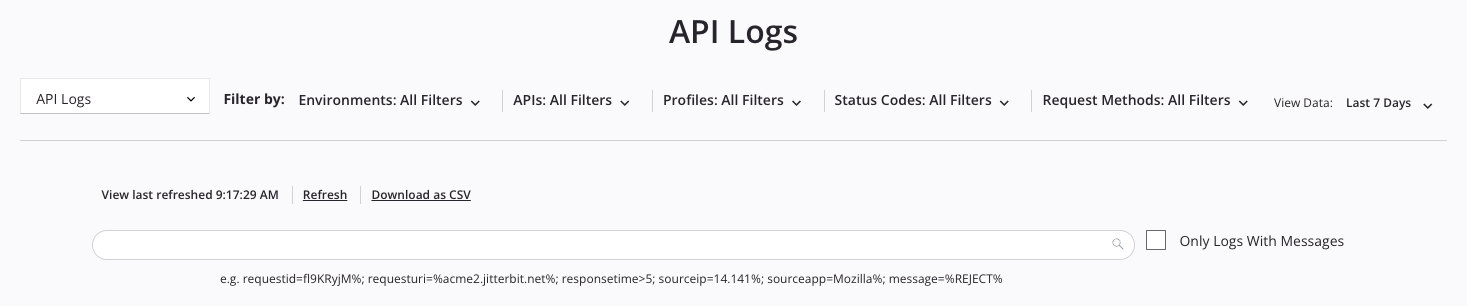
You can adjust the data displayed by using the Filter by and View Data dropdowns.
Filter by
The Filter by dropdowns allow you to display API logs based on specific criteria across any combination of environments, APIs, profiles, status codes, or request methods.
Each filter displays a dropdown list of criteria from which you can select one or multiple criteria.
These are the available criteria to filter by:
-
Environments: Use the dropdown to select environments where the APIs are located. When all filters are unselected, environments for all APIs in the organization to which you have access are displayed.
-
APIs: Use the dropdown to select published APIs within the organization. When all filters are unselected, all APIs in the organization to which you have access are displayed.
Note
Previously published APIs that become unpublished will not appear in the APIs dropdown. API logs for these APIs will be present on the API Logs page, but cannot be filtered.
-
Profiles: Use the dropdown to select the assigned security profiles of the APIs. When all filters are unselected, all security profiles in the organization to which you have access are displayed.
-
Status Codes: Use the dropdown to select the HTTP response status code groups, selecting from Success (2xx), Redirections (3xx), Client Errors (4xx), and Server Errors (5xx). When all filters are unselected, all HTTP response status codes for APIs in the organizations to which you have access are displayed. For more information on status codes, see w3.org status code definitions.
-
Request Methods: Use the dropdown to select the HTTP request methods, selecting from GET, PUT, POST, DELETE, PATCH, and MERGE. When all filters are unselected, all HTTP request methods for APIs in the organization to which you have access are displayed. For more information on HTTP request methods, see w3.org request methods.
View Data
The View Data option allows you to display logs within a specific period of time. The default setting for the period of time is Last 7 Days.
Use the View Data dropdown to select the desired period of time. Select one of Last 10 Minutes, Last 1 Hour, Last 10 Hours, Last 24 Hours, Last 7 Days, Last 1 Month, or Custom Period.
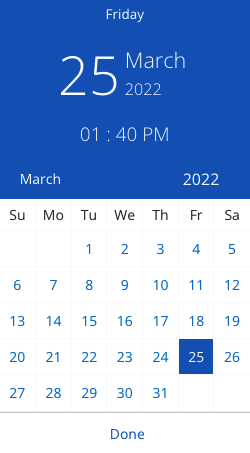
Selecting Custom Period allows you to display API logs within a specified time period. When this option is selected, additional From and To calendar fields display:

- From: Click to adjust the starting date and time for the API logs.
- To: Click to adjust the ending date and time for the API logs.
After clicking the From or To calendar fields, a calendar dialog is displayed where you select the date and time:
Search
The search bar allows you to filter the logs by the search criteria provided below:

- Only Logs with Messages: Select to further restrict search results only to logs that include logging details. The search results will automatically refresh.
Search criteria
These are the search criteria that can be used. Examples of valid and invalid search criteria are included:
| Criterion | Valid Search | Invalid Search |
|---|---|---|
| Request ID | requestid=123%;requestid=fI9KRyjM%; | requestid!=123%; |
| Request URI | requesturi=%acme2.jitterbit.net%;requesturi=%jitterbit.net/defaultUrlPrefix/test;requesturi=%[environment]/[version]/test;requesturi=%[environment]/[version]/test% | requesturi!=%acme2.jitterbit.net%; |
| Response Time | responsetime>5;responsetime<5;responsetime>=5;responsetime<=5;responsetime=0; | responsetime!=5; |
| Source IP | sourceip=14.141%; | sourceip!=14.141%; |
| Source Application | sourceapp=Mozilla%;sourceapp=%Chrome%; | sourceapp!=Mozilla%; |
| Message | message=%REJECT%;message=%Access Denied%;message=%Ran successfully!%; | message!=%REJECT%; |
Combine searches
Searches can contain a combination of criteria. Combined search criteria must be separated by a semi-colon (;) between each criterion. These are examples of valid combined searches:
message=%Access Denied%;requesturi=%contacts%;
requestid=%yzaccwui%;message=%REJECT%;
requesturi=%contacts%;responsetime<=2;
responsetime>=5;sourceapp=%Chrome%;
responsetime>=5;sourceip=70.5%;
sourceapp=%Chrome%;message=%REJECT%;
sourceapp=%Mozilla%;responsetime<=1;
sourceip=70.5%;requesturi=%contacts%;
Additional options
Additional API log options display on the left side of the page directly above the search bar:

-
View last refreshed: Displays the last time the data was refreshed either dynamically or manually. The time is displayed in the format
h:mm:ss. -
Refresh: Click to refresh the log data based on the applied filters and search criteria.
-
Download as CSV: Click to download the current log data based on the applied filters and search criteria.
Note
The date field within the CSV file is a UNIX timestamp that will require conversion if you want to use a different date and time format.
View API logs
Each row in the API Logs table displays API logging data for an API call:
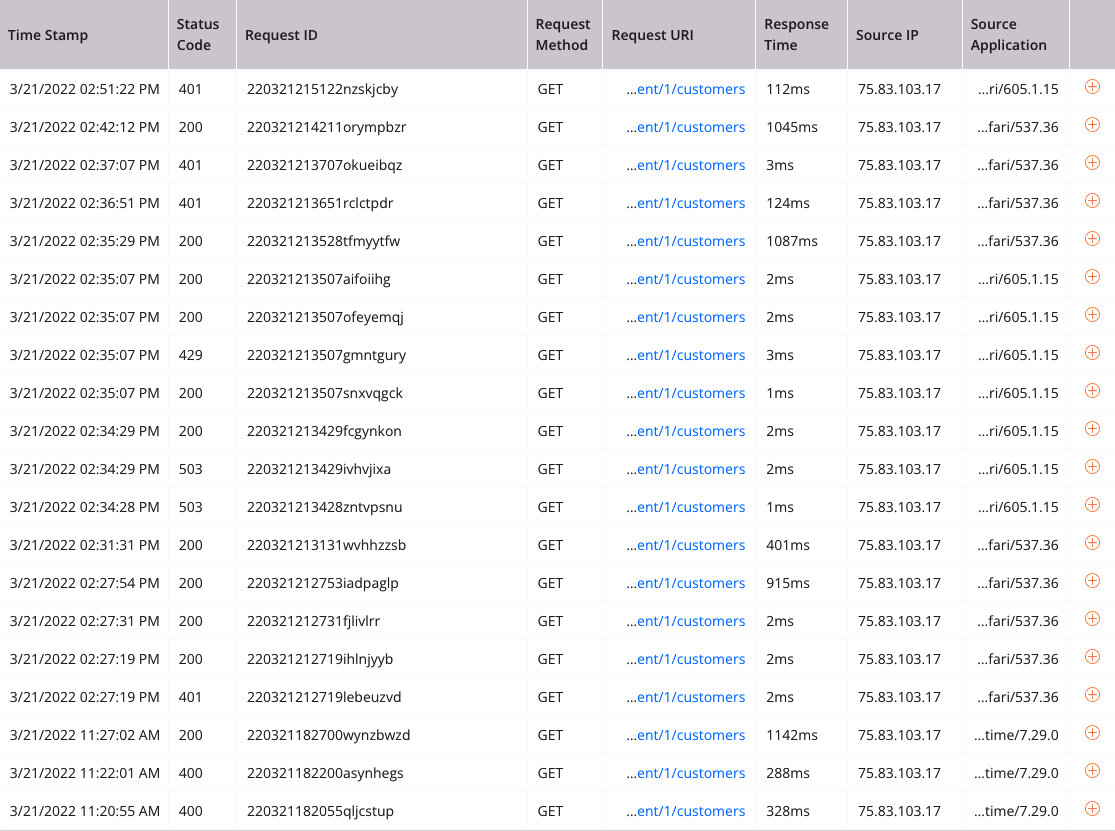
- Time Stamp: The timestamp of the API request. Times are displayed in your browser's time zone.
- Status Code: The HTTP status code. For more information on HTTP status codes, see w3.org status code definitions.
- Request ID: A unique ID for the API request.
- Request Method: The API's HTTP request method (GET, PUT, POST, DELETE, PATCH, or MERGE).
- Request URI: The full URL of the API that was called. Hover over the Request URI field to view the full URL.
- Response Time: The amount of time, in milliseconds, that the API took to execute.
- Source IP: The external IP address of the application or server that called the API.
- Source Application: The source application for the API call, present only when the API call is being passed in a request header. Hover over the Source Application column to view the contents of the field.
Each page displays 20 logs. You can view all the logs within the filter and search criteria using the Next and Previous buttons.
View log details
To view additional log details or debug logs (if enabled), click the
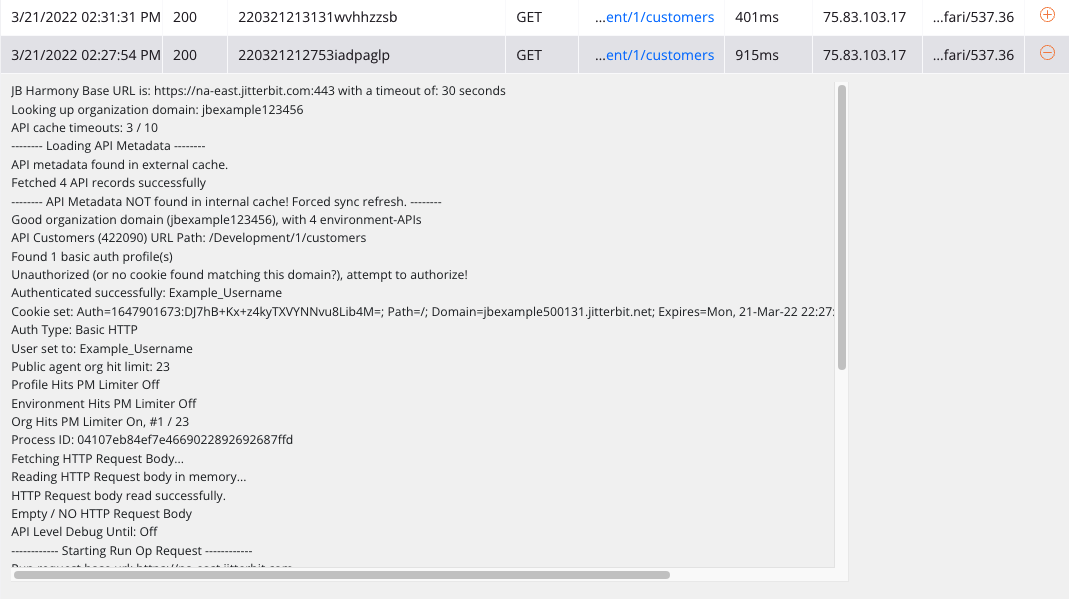
A typical API log will contain these details:
- Harmony region domain name, service path, and base URL (see API service URL)
- API call processing time
- Security profile information such as authorization type and credentials used
- Payload details including length of the payload and the response size
- Error information (if applicable)
- Debug logs (if enabled)
- Verbose logs (if enabled)
API Manager Log Service API (beta)
As an alternative to downloading an API log file by clicking Download as CSV, you can retrieve an API log file using a REST API. This requires the use of either command line utilities such as curl or applications such as Postman.
To use the API Manager Log Service API (Beta), after enabling API logs for the API Manager API (described earlier on this page), follow these steps:
-
Retrieve an authentication token using the User Service Controller API. This token is required in order to use the API Manager Log Service API (Beta).
-
If your Harmony organization does not have two-factor authentication (TFA) enabled, retrieve your authentication token with a standard login request.
-
If your Harmony organization has TFA enabled, retrieving the authentication token requires two requests:
-
-
Retrieve the log file using the API Manager Log Service API (Beta).
Retrieve an authentication token
Retrieving an authentication token requires the use of the User Service Controller API.
Important
If your Harmony organization has TFA enabled, this request will fail. Retrieving the authentication token requires two different requests.
An example request showing logging in to the NA region and retrieving the authorization token:
curl --location --request PUT 'https://na-east.jitterbit.com/jitterbit-cloud-restful-service/user/login' \
--header 'Content-Type: application/json' \
--data-raw '{
    "email": "alice@jbexample.com",
    "password": "Jitterbit4Ever!"
}'
Base URL
The base URL depends on the region that the organization is located in:
| Region | Base URL |
|---|---|
| NA | https://na-east.jitterbit.com/jitterbit-cloud-restful-service/user/login |
| EMEA | https://emea-west.jitterbit.com/jitterbit-cloud-restful-service/user/login |
| APAC | https://apac.jitterbit.com/jitterbit-cloud-restful-service/user/login |
Headers
These headers are required:
| Header | Required | Example | Description |
|---|---|---|---|
Content-Type | Required | 'Content-Type: application/json' | Indicates the format that will be sent in the request. |
Body parameters
These required parameters are passed in the body of the request:
| Required Parameter | Required | Type | Example | Description |
|---|---|---|---|---|
email | Required | String | alice@jbexample.com | Harmony username (email address) with a role with Admin permission in the organization |
password | Required | String | Jitterbit4Ever! | Harmony user password |
Response body
The returned response body contains a list of the organizations that the user is associated with in addition to the authentication token ("authenticationToken"). This token is required for subsequent authorization with the API Manager Log Service API (Beta). In this example, the authentication token is "1_70dfe7f7-1d47-4ad5-be5d-bc4a222dd2g4". The organization ID is shown as "123456" for the first organization that this user belongs to. An example of the response:
{
  "status": true,
  "operation": "User login",
  "authenticationToken": "1_70dfe7f7-1d47-4ad5-be5d-bc4a222dd2g4",
  "serverUrl": "https://na-east.jitterbit.com",
  "cloudAppsUrl": "https://na-east.jitterbit.com",
  "orgAttrs": [
    {
      "orgId": "123456",
      "orgName": "JB Example Company",
      "orgZoneUrl": "https://na-east.jitterbit.com"
    },
    {
      "orgId": "20970",
      "orgName": "example@jbexample.com",
      "orgZoneUrl": "https://na-east.jitterbit.com"
    }
  ],
  "defaultOrgId": "123456",
  "sessionTimeoutInSeconds": 14400
}
Retrieve an authentication token with TFA enabled
If a user's Harmony organization has two-factor authentication (TFA) enabled, retrieving the authentication token requires two requests using the User Service Controller API:
Retrieve a TFA code
A valid TFA code is required to retrieve an authentication token when TFA is enabled. An example request showing logging in to the NA region and requesting a TFA code:
curl --location --request PUT 'https://na-east.jitterbit.com/jitterbit-cloud-restful-service/user/login' \
--header 'Content-Type: application/json' \
--data-raw '{
    "email": "alice@jbexample.com",
    "password": "Jitterbit4Ever!",
    "deviceId": "abcd"
}'
Base URL
The base URL depends on the region that the organization is located in:
| Region | Base URL |
|---|---|
| NA | https://na-east.jitterbit.com/jitterbit-cloud-restful-service/user/login |
| EMEA | https://emea-west.jitterbit.com/jitterbit-cloud-restful-service/user/login |
| APAC | https://apac.jitterbit.com/jitterbit-cloud-restful-service/user/login |
Headers
These headers are required:
| Header | Required | Example | Description |
|---|---|---|---|
Content-Type | Required | 'Content-Type: application/json' | Indicates the format that will be sent in the request. |
Body parameters
These required parameters are passed in the body of the request:
| Required Parameter | Required | Type | Example | Description |
|---|---|---|---|---|
email | Required | String | alice@jbexample.com | Harmony username (email address) with a role with Admin permission in the organization |
password | Required | String | Jitterbit4Ever! | Harmony user password |
deviceId | Required | String | abcd | Identifier that will be used to confirm the TFA code in the next request |
Response body
The returned response body contains an error message indicating that a TFA code was sent to the user's email address.
{
  "status": false,
  "operation": "User login",
  "errorCode": "VALIDATE_TFA_LOGIN_EMAIL",
  "errorMessage": "Validate your login with authentication code. An email from Jitterbit with the code was sent to you.",
  "authenticationToken": null,
  "serverUrl": "https://na-east.jitterbit.com",
  "orgAttrs": [],
  "defaultOrgId": null
}
Use the TFA code to retrieve an authentication token
The TFA code sent to the user's email address can now be used in the second request to retrieve the authentication token. An example request showing logging in to the NA region with a TFA code and retrieving the authorization token:
curl --location --request PUT 'https://na-east.jitterbit.com/jitterbit-cloud-restful-service/user/login/code' \
--header 'Content-Type: application/json' \
--data-raw '{
    "email": "alice@jbexample.com",
    "password": "Jitterbit4Ever!",
    "code": "112233"
    "deviceId": "abcd"
}'
Base URL
The base URL depends on the region that the organization is located in:
| Region | Base URL |
|---|---|
| NA | https://na-east.jitterbit.com/jitterbit-cloud-restful-service/user/login/code |
| EMEA | https://emea-west.jitterbit.com/jitterbit-cloud-restful-service/user/login/code |
| APAC | https://apac.jitterbit.com/jitterbit-cloud-restful-service/user/login/code |
Headers
These headers are required:
| Header | Required | Example | Description |
|---|---|---|---|
Content-Type | Required | 'Content-Type: application/json' | Indicates the format that will be sent in the request. |
Body parameters
These required parameters are passed in the body of the request:
| Required Parameter | Required | Type | Example | Description |
|---|---|---|---|---|
email | Required | String | alice@jbexample.com | Harmony username (email address) with a role with Admin permission in the organization |
password | Required | String | Jitterbit4Ever! | Harmony user password |
code | Required | String | 112233 | TFA code sent to the Harmony user's email |
deviceId | Required | String | abcd | Identifier submitted to generate the TFA code in the previous request |
Response body
The returned response body contains a list of the organizations that the user is associated with in addition to the authentication token ("authenticationToken"). This token is required for subsequent authorization with the API Manager Log Service API (Beta). In this example, the authentication token is "1_70dfe7f7-1d47-4ad5-be5d-bc4a222dd2g4". The organization ID is shown as "123456" for the first organization that this user belongs to. An example of the response:
{
  "status": true,
  "operation": "User login",
  "authenticationToken": "1_70dfe7f7-1d47-4ad5-be5d-bc4a222dd2g4",
  "serverUrl": "https://na-east.jitterbit.com",
  "cloudAppsUrl": "https://na-east.jitterbit.com",
  "orgAttrs": [
    {
      "orgId": "123456",
      "orgName": "JB Example Company",
      "orgZoneUrl": "https://na-east.jitterbit.com"
    },
    {
      "orgId": "654321",
      "orgName": "example@jbexample.com",
      "orgZoneUrl": "https://na-east.jitterbit.com"
    }
  ],
  "defaultOrgId": "123456",
  "sessionTimeoutInSeconds": 14400
}
Retrieve API logs asynchronously (beta)
Once you have the authentication token and the organization ID, you can retrieve API logs asynchronously using the API Manager Log Service API (Beta). An example showing retrieving all records from January 20, 2023 to January 20, 2024:
curl --location --request PUT 'https://na-east.jitterbit.com/jitterbit-cloud-restful-service/api/analytics/debuglogs-async' \
--header 'Content-Type: application/json' --header 'Accept: application/json' --header 'authToken: 1_70dfe7f7-1d47-4ad5-be5d-bc4a222dd2g4' \
--data-raw '{
    "ascendSort": false,
    "retrieveLogMessages": false,
    "timeRangeFrom": "01/20/2023 01:01:00 +0100",
    "timeRangeTo": "01/20/2024 01:01:00 +0100",
    "clientTimeZone": "Europe/Berlin",
    "queryString": "responsetime>5; sourceip=14.141%",
    "orgId": "123456",
    "csvFormat": true
}'
Base URL
The base URL depends on the region that the organization is located in:
| Region | Base URL |
|---|---|
| NA | https://na-east.jitterbit.com/jitterbit-cloud-restful-service/api/analytics/debuglogs-async |
| EMEA | https://emea-west.jitterbit.com/jitterbit-cloud-restful-service/api/analytics/debuglogs-async |
| APAC | https://apac.jitterbit.com/jitterbit-cloud-restful-service/api/analytics/debuglogs-async |
Headers
These headers can be used in the request:
| Header | Required | Example | Description |
|---|---|---|---|
Content-Type | Required | 'Content-Type: application/json' | Indicates the format that will be sent in the request. |
Accept | Required | 'Accept: application/json' | Indicates the format that will be accepted in the response. |
authToken | Required | 'authToken: 1_70dfe7f7-1d47-4ad5-be5d-bc4a222dd2g4' | Passes the authorization token (authenticationToken) returned by the User Service Controller API. |
Body parameters
These parameters can be passed in the body of the request:
| Key | Required | Type | Example | Description |
|---|---|---|---|---|
ascendSort | Optional | Boolean | false | The sort order of the log entries, one of true or false. By default, this value is false. |
retrieveLogMessages | Optional | String | false | The visibility of messages in the retrieved log entries, one of true or false. By default, this value is false. |
timeRangeFrom | Required | String | 01/20/2023 01:01:00 +0100 | The start date and time for filtering log entries in a time range. |
timeRangeTo | Required | String | 01/20/2024 01:01:00 +0100 | The end date and time for filtering log entries in a time range. |
clientTimeZone | Optional | String | Europe/Berlin | The time zone identifier to resolve times to. For a list of valid identifiers, see the list of tz database time zones. By default, this value is UTC. |
queryString | Optional | String | responsetime>5; sourceip=14.141% | The query string for filtering log entries based on the provided condition. Conditions can be a list of comparisons between column values and known values, each delimited by a semicolon (;). Valid column names include time, requestid, requesturi, responsetime, sourceip, sourceapp, and message. Valid comparison operators include =, <>, !=, >, <, >=, and <=. |
orgId | Required | String | 123456 | Your Harmony organization ID. The organization must be located in the region that matches the base URL. |
csvFormat | Optional | Boolean | true | The format of the output, one of true for CSV or false for JSON. By default, this value is true. |
Response body
If successful, the returned response body contains a reference key for tracking and downloading the API log file based on the supplied parameters:
{
    "key": "debug-log-E8D47FE1F172D3EE46C620791E614B78D111CE624485D2E1B3D482370690DC40",
    "status": "COMPLETE"
}
The reference key can then be supplied as part of the following API call to check on the log file's status or to download it if the status is COMPLETE:
curl --location --request GET 'https://na-east.jitterbit.com/jitterbit-cloud-restful-service/api/analytics/log-async/{orgId}/{key}' \
--header 'Content-Type: application/json' --header 'Accept: application/json' --header 'authToken: 1_70dfe7f7-1d47-4ad5-be5d-bc4a222dd2g4'
Possible statuses include:
- RECEIVED: Harmony received a valid request to generate the log file. The status will transition to PROCESSING when the request is being executed.
- PROCESSING: The log file is being generated. The status will transition to COMPLETE the file generation is complete.
- COMPLETE: The log file is ready to be downloaded using the
log-asyncAPI above. - INVALID: The reference key could not be found. This status is only reported if an unknown or malformed reference key is supplied to the
log-asyncAPI. - ERROR: The reference key was found after the API finished trying to generate the log file, but an error was reported. An error message will also be returned detailing why the generation failed.
- NO_DATA: The filtering parameters querying data in the original API call returned 0 results.
Important
The generated file will be saved for 24 hours. The reference key will be saved for 23 hours. The same exact request will not generate more files during this period of time unless the request returned an ERROR or NO_DATA status.
Caution
In the event an error occurs during the RECEIVED or PROCESSING statuses, the request will be locked until the reference key expires. Changing any parameter of a request will make it distinct, allowing for workaround requests if this issue is encountered.