Performance debugging and enhancement in Jitterbit App Builder
Chrome developer tools
Chrome DevTools is a set of web developer tools built directly into the Google Chrome browser. Using Chrome's DevTools you can diagnose issues in App Builder with requests that aren't getting answered or handled correctly, record a HAR file which used for further troubleshooting, and help pinpoint issues with page load times.
Chrome DevTools also provides tools for you to capture screenshots, emulate a mobile user's experience, and analyze requests being made by the page as it loads to identify specific areas impacting page load time.
Note
To download Google Chrome: https://www.google.com/chrome/
Identifying HTTP error codes with Chrome
The Chrome DevTools allows you to quickly view and filter HTTP error codes to help isolate and identify an error with an App Builder app request that isn't getting answered or handled correctly. HTTP response status codes indicate whether a specific HTTP request has been successfully completed.
From the Chrome DevTools Network tab, you can quickly filter the resultant information by clicking on the column headers. Here you can click on Status to view HTTP code results and identify any tasks that aren't returning a 200 OK result.
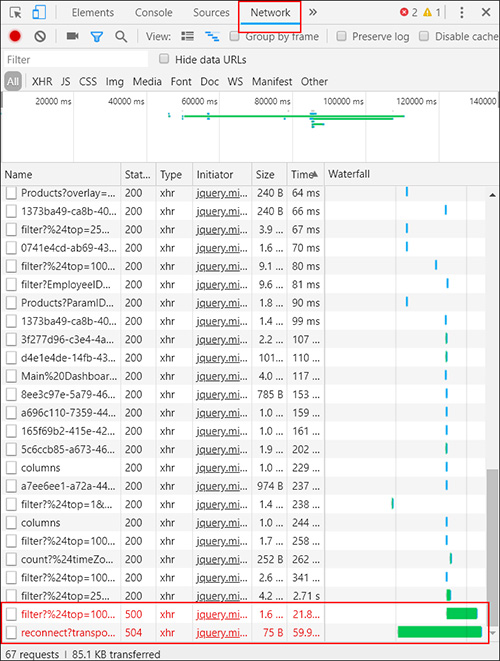
In the screenshot example, from the Chrome DevTools Network tab we see that the app page is throwing 500 Internal Server Error and 504 Gateway Timeout error messages. Information contained in the Name column of this result helps define where in App Builder this error is being initiated.
Here's a list of the most common HTTP error code results:
- 301 Moved permanently
- 302 Found
- 307 Temporary redirect
- 308 Permanent redirect
- 400 Bad Request = Client Error
- 401 Unauthorized = Client Error
- 403 Forbidden = Client Error
- 404 Not Found = Client Error
- 405 Method Not Allowed = Client Error
- 500 Internal Server Error = Server Error
- 502 Bad Gateway = Server Error
- 503 Service Unavailable = Server Error
- 504 Gateway Timeout = Server Error
Note
For more HTTP error codes, please see: https://developer.mozilla.org/en-US/docs/Web/HTTP/Status
Generating a har file with Chrome
When troubleshooting complex App Builder issues, having a HAR file recorded and generated from Chrome Web Developer tools may be useful and/or requested by an App Builder developer to further troubleshoot. A HAR file captures a log of network requests and activity at the time the issue in question is happening. Specifically, a HAR is a JSON-formatted archive file format for logging of a web browser's interaction with a site.
To generate a har file:
- Open Google Chrome and go to the App Builder page where the issue is happening
- From the Chrome menu bar select View > Developer > Developer Tools
- From the panel opened at the bottom of your screen, select the Network tab
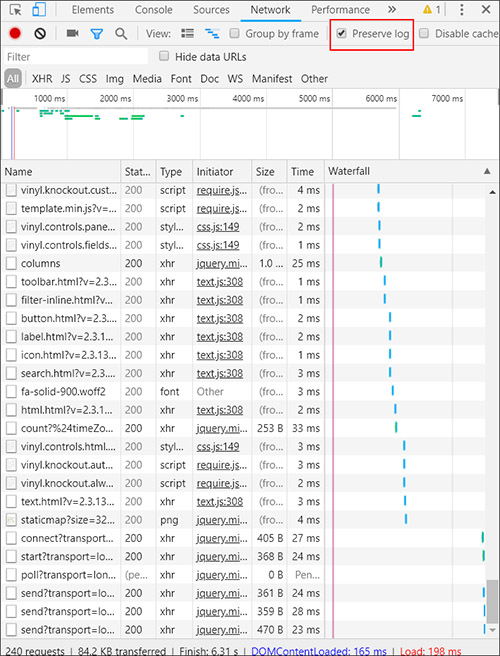
- Look for a round red Record button in the upper left corner of the Network tab, and make sure it is red. If it is grey, click on it once to start recording.
- Check the box next to Preserve log
- Click the Clear button to clear out any existing logs from the Network tab
-
Now try to reproduce the issue that you were experiencing before, while the network requests are being recorded
-
Once you reproduce the issue, right click on the grid of Network requests, select Save as HAR with Content and save the file to your computer
For more information: See "Get Started with Analyzing Network Performance in Chrome DevTools" https://developers.google.com/web/tools/chrome-devtools/network-performance/
Identifying performance issues with Chrome
Chrome DevTools Tools can help identify performance issues in your App Builder app. If you first navigate to the page where you're experiencing a performance issue, you can then open the DevTools and take a look at the Network tab, and sort on the Time column. Sort so that you can see which requests are taking the longest amount of time. The corresponding Name and Initiator columns give you additional information about the request originating from the App Builder app.
Note that if from the Network tab results you find that requests named filter? are taking up most of the page load time, this indicates you likely need to optimize the corresponding Business Object.
Business Objects (or Data Objects) can be a source of slow page load times. If you identify that a longer running request originates from a Business Object, please see the next section describing reasons why a Data Object is slow and options to improve speed.
Reasons a business object is slow and options to improve speed
Depending on the way they are configured, Business Objects (also referred to as Data Objects) can be a cause of App Builder app performance issues or slowness. Specific reasons that a Business Object could be slow include:
- SQL logic contains many subqueries
- Unneeded Columns are used in logic
- Where clauses are not using index-friendly statements
- Indexes are not defined on a Table(s) that a Data Object is using
- Redundant indexes on Table(s) being referenced by the SQL logic
- Joining on calculated Columns
- Index usage may be lost due to logic running through functions
- Binary field is included when the Binary field is not being used by a Panel
- Only include Binary field(s) in Business Objects if it's used as a file control
- It is worth creating Business Objects specifically to use on Panels where a file is uploaded/downloaded
- All Columns in a Business Object will be loaded by App Builder for the following conditions:
- Conditional Formatting exists
- If a field has Supports Substitution enabled
- If a panel has any non static Visibility Rules
Business Objects can still cause slow loading times with app pages, even if the resultant Business Object 'Results' load quickly. Check to see if there are things on your app page impacting speed, such as sorting, list boxes, or other UI Layer settings that may cause slower page load times.
Flattening SQL queries
If you have identified a specific Business Object is causing performance issues, there may be an opportunity to improve the SQL logic and potentially flatten the query.
- Most times you should re-use subqueries
- Sometimes a query can become so large with nested subqueries that it runs slow – only then should it be reviewed and rewritten
- Flattening the query (removing unnecessary subqueries) usually improves performance
- Can examine execution plan and indexes
Removing unused columns
Oftentimes queries with performance issues are using Columns in the SQL logic that are unnecessary.
- Frequently we find that queries with performance issues have subqueries that select way more data than is used by the outer query
- Removing these columns (particularly columns that are calculated) will improve performance
- Use Copy Rule and start making changes
- Time how long "Results" takes to return. Also time how long to return "Load more rows".
Index friendly statements in WHERE clauses
The Where Clause defines the search condition of an SQL statement, and it thus falls into the core functional domain of an index: finding data quickly. A poorly written Where Clause is often a culprit in a slowly performing SQL query. A Where Clause should be efficient and include the right index(es).
Bad (indexes won't be used):
- Where LOWER(FirstName) like '%Bob%
- Where NOW() > DATEADD(minutes,60,StartTime)
Good (indexes used):
- Where FirstName like 'Bob%'
- Where DateAdd(minutes,-60,NOW()) > StartTime
SQL Server has trace mode and query plan utilities you can run to see if indexes are being used.
Settings to improve performance
This section will illustrate settings in App Builder that impact performance. Avoid search/filter/sort on columns in large tables that aren't indexed – when slow queries are detected, and indexes aren't an option.
At the Panel level, enabling Support Download and having Simple Search On, and configured as Indexed Only can help improve performance.
Note
When searching indexed fields, App Builder generates index-friendly queries:
…FirstName like 'Bob%'…
Will match: "Bob Smith"
Will not match: "Mr Bobert"
Indexes and what should get indexed
In SQL an Index is used to speed up the performance of queries by helping fetch your data faster from SQL Server. This is achieved by reducing the number of database data pages that have to be visited/scanned. When thinking about indexes in App Builder Data Objects, you need enough indexes to speed up your SELECT queries and at the same time you should not create redundant indexes which could potentially slow down your UPDATE/DELETE operations.
Index architectures are classified as clustered or non-clustered. Clustered indexes are indexes whose order of the rows in the data pages correspond to the order of the rows in the index. This is why only one clustered index can exist in a given table, whereas, many non-clustered indexes can exist in the table.
In App Builder, Indexes are created on Table objects. Generally speaking every table should have a clustered index to allow efficient searching of the data in that table. When a Table is missing an Index value, that can contribute to slowing down an application speed. Make certain that the primary key for each table and any unique key columns that exist are indexed. When considering modifying indexes in App Builder, keep in mind the following key points:
- You want to balance creating indexes with the performance hit it is going to make on insert/update statements. Adding indexes will speed up queries, but slow down insert/update/delete.
- You also need to consider indexing columns that you use to order by and those that you use in a grouping expression. You might benefit from indexing the columns that the MIN(), MAX(), COUNT(), SUM(), and AVG() functions use to aggregate the data
- You can take advantage of "covering indexes", where you have one bigger index that can be leveraged by queries that use subsets of the columns.
- Order of columns in the index is important
- The recommendation is for the inequality columns to come after equality columns in your covering indexes
Missing index tools
There are existing SQL Server utilities and queries that can be leveraged to help with the process of reviewing indexes. Dynamic management views (DMVs) are SQL Server utilities that return server state information and can be used to monitor the health of your database server and diagnose problems. DMVs give great insight about what is going on inside SQL Server. Running these requires VIEW DATABASE STATE permission on the database in question.
You can identify missing indexes in your SQL queries by 3 ways primarily —
- Running the Database Engine Tuning Advisor
- Executing Missing Index Dynamic Management Views
- SQL Server Engine prompts missing indexes when you generate Execution Plans in SSMS
Following are 3 SQL queries often used to help identify issues with indexes:
FindingLongRunningQueries.sql
SET TRANSACTION ISOLATION LEVEL READ UNCOMMITTED
SELECT TOP 20
CAST(qs.total_elapsed_time / 1000000.0 AS DECIMAL(28, 2))
AS [Total Duration (s)]
, CAST(qs.total_worker_time * 100.0 / qs.total_elapsed_time
AS DECIMAL(28, 2)) AS [% CPU]
, CAST((qs.total_elapsed_time - qs.total_worker_time)* 100.0 /
qs.total_elapsed_time AS DECIMAL(28, 2)) AS [% Waiting]
, qs.execution_count
, CAST(qs.total_elapsed_time / 1000000.0 / qs.execution_count
AS DECIMAL(28, 2)) AS [Average Duration (s)]
, SUBSTRING (qt.text,(qs.statement_start_offset/2) + 1,
((CASE WHEN qs.statement_end_offset = -1
THEN LEN(CONVERT(NVARCHAR(MAX), qt.text)) * 2
ELSE qs.statement_end_offset
END - qs.statement_start_offset)/2) + 1) AS [Individual Query]
, qt.text AS [Parent Query]
, DB_NAME(qt.dbid) AS DatabaseName
, qp.query_plan
FROM sys.dm_exec_query_stats qs
CROSS APPLY sys.dm_exec_sql_text(qs.sql_handle) as qt
CROSS APPLY sys.dm_exec_query_plan(qs.plan_handle) qp
WHERE qs.total_elapsed_time > 0
ORDER BY qs.total_elapsed_time DESC
IdentifyMostImportantMissingIndexes.sql
SET TRANSACTION ISOLATION LEVEL READ UNCOMMITTED
SELECT TOP 20
    ROUND(s.avg_total_user_cost *s.avg_user_impact*  (s.user_seeks + s.user_scans),0) AS [Total Cost]
    , d.[statement] AS [Table Name]
    , equality_columns
    , inequality_columns
    , included_columns
FROM sys.dm_db_missing_index_groups g
    INNER JOIN sys.dm_db_missing_index_group_stats s
        ON s.group_handle = g.index_group_handle
    INNER JOIN sys.dm_db_missing_index_details d
        ON d.index_handle = g.index_handle
WHERE d.database_ID = DB_ID()
ORDER BY [Total Cost] DESC
IdentityUnusedIndexes.sql
SET TRANSACTION ISOLATION LEVEL READ UNCOMMITTED
SELECT
    DB_NAME() AS DatabaseName
    , SCHEMA_NAME(o.Schema_ID) AS SchemaName
    , OBJECT_NAME(s.[object_id]) AS TableName
    , i.name AS IndexName
    , s.user_updates
    , s.system_seeks + s.system_scans + s.system_lookups AS [System usage]
INTO    #TempUnusedIndexes
FROM    sys.dm_db_index_usage_stats s
    INNER JOIN sys.indexes i
        ON s.[object_id] = i.[object_id]
        AND s.index_id   = i.index_id
    INNER JOIN sys.objects o
        ON i.object_id   = O.object_id
WHERE     1=2

EXEC sp_MSForEachDB 'USE [?];
INSERT INTO #TempUnusedIndexes
SELECT TOP 20
    DB_NAME() AS DatabaseName
    , SCHEMA_NAME(o.Schema_ID) AS SchemaName
    , OBJECT_NAME(s.[object_id]) AS TableName
    , i.name AS IndexName
    , s.user_updates
    , s.system_seeks + s.system_scans + s.system_lookups
    AS [System usage]
FROM    sys.dm_db_index_usage_stats s
    INNER JOIN sys.indexes i
        ON s.[object_id] = i.[object_id]
        AND s.index_id = i.index_id
    INNER JOIN sys.objects o ON i.object_id = O.object_id
WHERE     s.database_id = DB_ID()
AND     OBJECTPROPERTY(s.[object_id], ''IsMsShipped'') = 0
AND     s.user_seeks = 0
AND     s.user_scans = 0
AND     s.user_lookups = 0
AND     i.name IS NOT NULL
ORDER BY s.user_updates DESC'

SELECT     TOP 20 *
FROM     #TempUnusedIndexes
ORDER BY [user_updates] DESC
DROP TABLE #TempUnusedIndexes
Using SQL statement from logs and index optimizer
Once you have identified a Business Object that has performance issues, you can retrieve the SQL statement logic from the App Builder logs and run it through an index optimizer utility to identify areas for improvement. This might result in identifying indexes to be added, for example.
To retrieve the SQL statement logic, navigate in the app to the page where the Business Object is being used. From here:
- Go to the IDE > Monitoring
- Click Database Logs from the Menu
- Click the Edit Configuration button
- Click Edit
-
In the Memory Log Configuration section, set the Minimum Severity to Trace.
Important
Always reset the Minimum Severity value back to Off when finished capturing log information.
-
Click the Save button
- You should now be viewing the Fast Logs screen in App Builder, which consists of 500 lines of log data (unless you modify that 500 value). Scroll through the log data until you locate the SQL statement logic you're looking for.
-
Copy the entire SQL statement logic, starting with SELECT. For example:
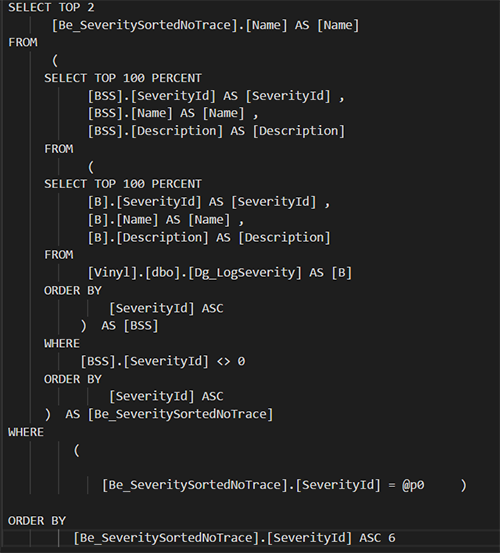
-
Click the Edit Configuration button
- Click Edit on the Log Configuration screen
- In the Memory Log Configuration section, set the Minimum Severity to Off
- Launch SQL Server Management Studio
- Connect to your database connection
- There are a few different paths you leverage in SQL Server Management Studio to ultimately better optimize some of the SQL statement logic your app is using
- You can click the New Query button, set the Available Database to the corresponding database for the app you're reviewing
-
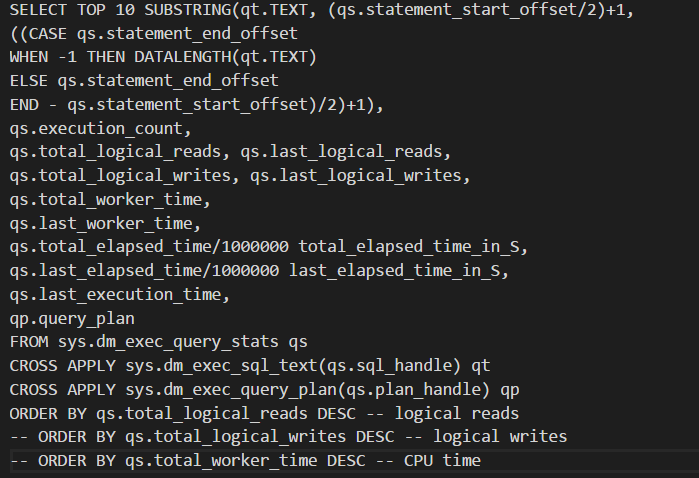
Enter the following query syntax, which is a query to find the Top 10 SQL queries that use the most resources (reads, writes, worker time (CPU), etc):
-
Click the Execute button
-
Results will display the top 10 SQL queries that are taking the most amount of time to return information in your app. Note that the second entry in our example screenshot returns the same query we identified above (SELECT TOP 2…).

-
Click the New Query button from the toolbar
- Enter the SQL statement logic you copied from the App Builder logs
-
Select the corresponding database from the Available Database select menu
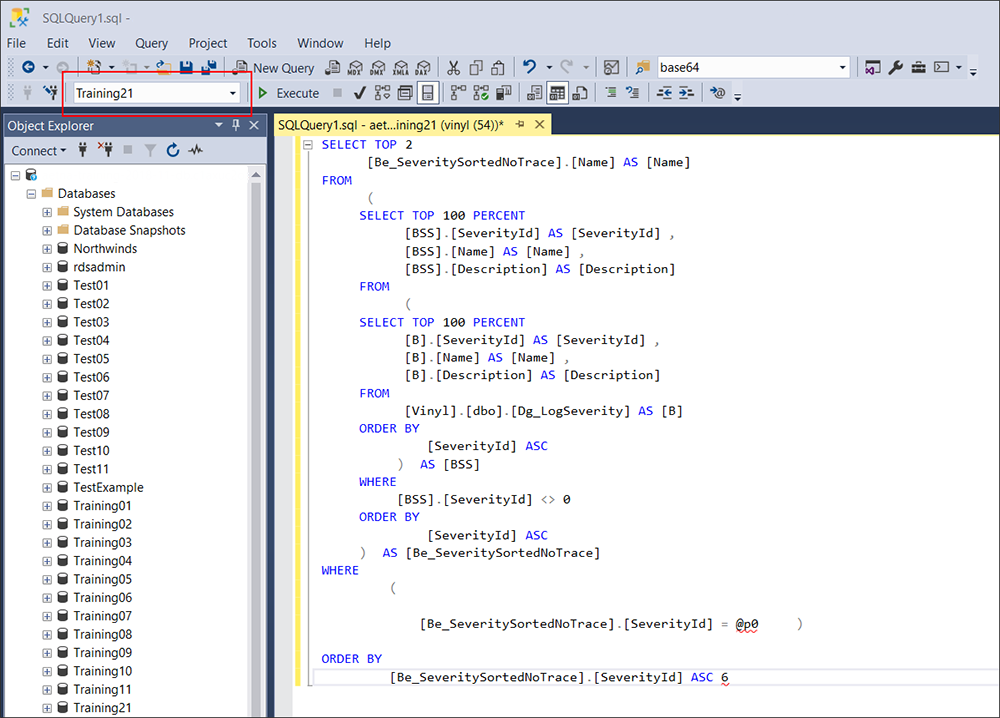
-
If you are using SQL Server database (SQL Express does not support this), you can right mouse click inside of the SQL Query panel and select Analyze Query in Database Engine Tuning Advisor. Here you can also leverage the execution plan utility, which will map out the trip the SQL statement takes through the app database and helps pinpoint areas that may be taking a lot of time for tuning.
Database tuning is a complex and technical skill set, requires the right permissions to access and view database(s), and should be done methodically, carefully, and with rigorous testing done throughout the process to ensure the net result is positive.
Resources
- Query Performance Tuning (SQL Server Compact): https://technet.microsoft.com/en-us/library/ms172984(v=sql.110).aspx
- SQL Server 2017 - Microsoft's "Index Related Dynamic Management Views and Functions (Transact-SQL)": https://docs.microsoft.com/en-us/sql/relational-databases/system-dynamic-management-views/index-related-dynamic-management-views-and-functions-transact-sql?view=sql-server-2017