Operation logs
Introduction
When an operation is executed, an operation log is generated. An operation log contains information about when and where an operation ran, the operation status, the number of source and target records processed, and any log messages. Whether detailed log messages are displayed depends on permission and access levels and whether cloud logging is enabled. When operation debug logging (for cloud agents or for private agents) is enabled for an individual operation, each operation log also contains input and output data for the operation.
Operation logs, including detailed log messages from both cloud agents and private agents, and component input and output data within operation logs, are retained for 30 days by Harmony.
Operation logs can also be viewed on the Management Console Runtime Operations page.
Important
By default, successful API operations (configured for Custom APIs or OData services) are not included in the operation logs unless one of these settings is enabled:
EnableLogging=true in the [APIoperation] section of the private agent configuration file. Access operation logs
Operation logs can be accessed in Cloud Studio at the project, workflow, or operation level. Depending on where they are accessed, the operation log screen includes logs for all operations that have been executed in a project, in a particular workflow, or for a particular operation, respectively. If operations are linked with operation actions, logs for downstream operations are also included.
By project
The View Logs option for a project, which shows logs for operations that have been executed within a project, can be accessed from these locations:
- The Projects page (see Card view or List view in Projects).
- The project toolbar (see Project actions menu in Project toolbar).
By workflow
The View Logs option for a workflow, which shows logs for operations that have been executed within a particular workflow, can be accessed from the project pane's Workflows tab (see Workflow actions menu in Project pane Workflows tab).
By operation
The View Logs option for an operation is accessible from these locations:
- The project pane's Workflows tab (see Component actions menu in Project pane Workflows tab).
- The project pane's Components tab (see Component actions menu in Project pane Components tab).
- The design canvas (see Component actions menu in Design canvas).
In addition, after running an operation manually, you can click the operation status on the design canvas to display the logs (see Operation status in Operation deployment and execution).
Operation log views
The operation log screen has two views: full screen and drawer. Which view is displayed depends on where the logs are accessed from:
-
Full Screen: When viewing logs by project, the full screen view loads, with the operation log screen loading in a new tab:
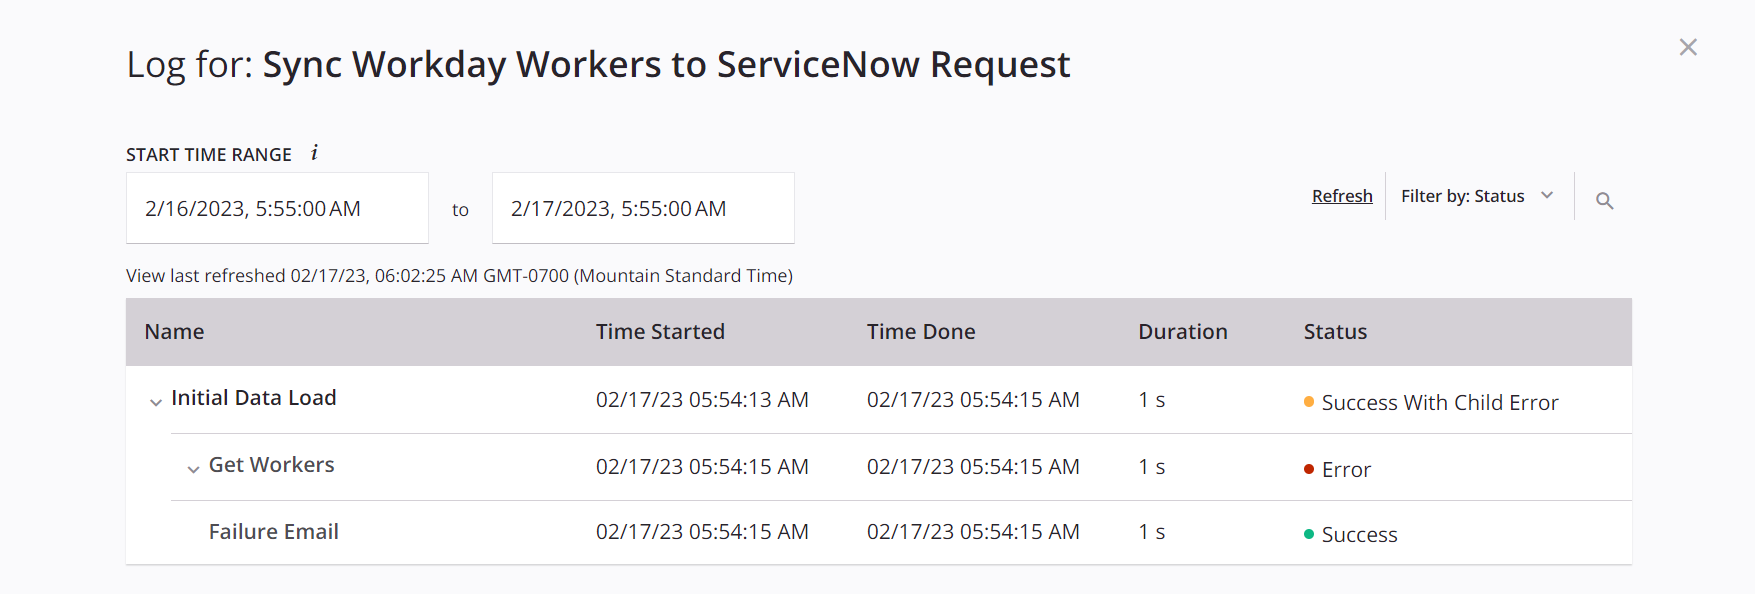
- Project Name: The project name (after the text Log for:) is listed along the top of the operation log screen.
- Close: To return to the previous screen, click the close icon
 .
.
-
Drawer: When viewing logs by workflow or operation, an operation log drawer opens along the bottom of the project designer to maintain your context in the project:
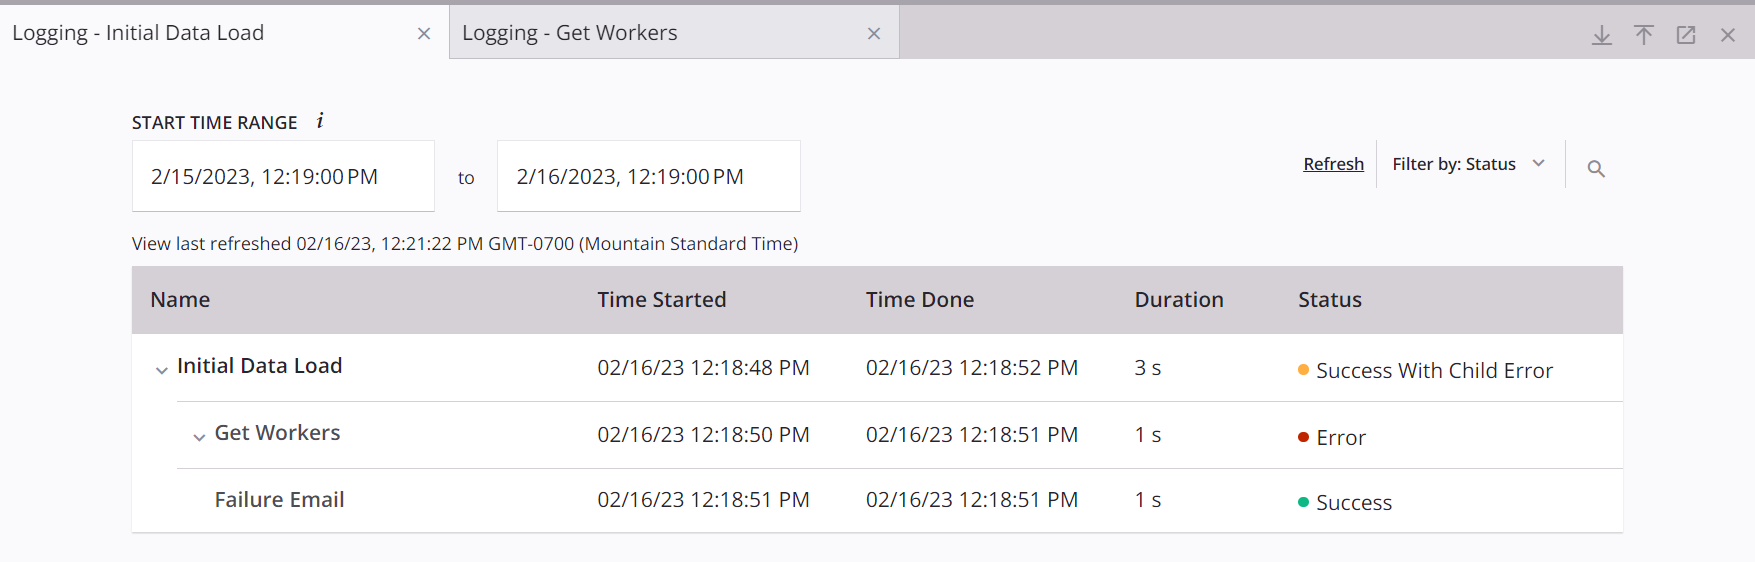
- Tabs: Tabs along the top of the operation log drawer are labeled with Logging followed by the name of the operation or workflow (depending on where the logs were accessed from). When you access additional logs, new tabs are added. To reorder tabs, drag and drop a tab. To close a tab, click its close icon
 . Closing the last tab or using the rightmost close icon closes the log drawer.
 - Resize: The bar along the top of the log drawer can be used to resize the log drawer. Hover over the bar and drag the resize icon
 up or down to resize the log drawer.
 - Collapse: The collapse icon
 collapses the log drawer so that all logs are hidden. Once collapsed, click the return icon to return to the previous view.
 - Expand: The expand icon
 expands the log drawer so that any additional logs are displayed. Once expanded, click the return icon to return to the previous view.
 - Open in a New Tab: The popout icon
 opens the full screen operation log view in a new tab.
 - Close: The close icon
 closes the log drawer.
- Tabs: Tabs along the top of the operation log drawer are labeled with Logging followed by the name of the operation or workflow (depending on where the logs were accessed from). When you access additional logs, new tabs are added. To reorder tabs, drag and drop a tab. To close a tab, click its close icon
The information in the remainder of the body of these views is the same in both views and is covered in the following subsections.
Operation log table controls
Both operation log screen views have the same controls along the top of the operation log table, including a filter for timeframe, ability to refresh the log table, a filter on operation status, and a search box.
Timeframe
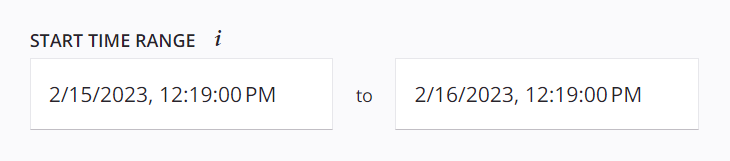
By default, the Start Time Range is configured so that the past 24 hours of logs since last running an operation are shown:
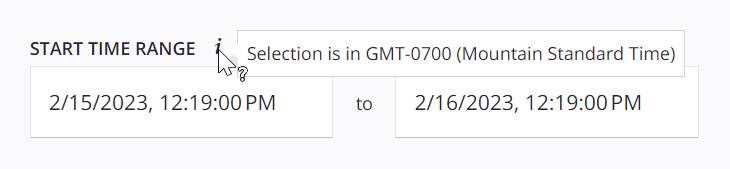
The date and time for time range selection uses local browser time. Hover over the Start Time Range tooltip to see the local browser time zone:
To change the timeframe by which the logs are filtered, click within a Start Time Range field to open the date/time picker. Then use the controls within the picker to adjust the date and/or time:
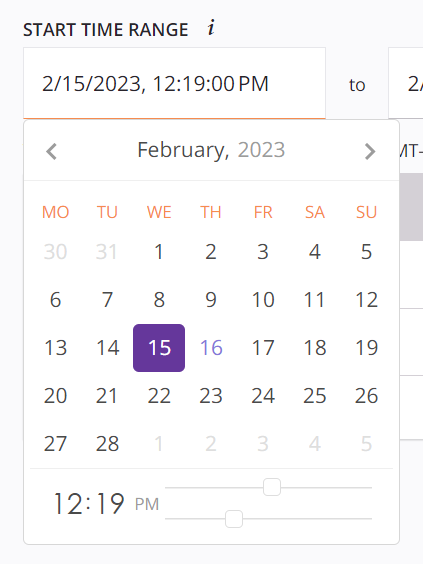
-
Month: The current month is used by default. Use the arrows
 to navigate to a different month.
 -
Year: The current year is used by default. Click the year, and then use the arrows
to navigate to a different year. Then select the desired month of the year from the month picker. Selecting a month returns you to the date/time picker.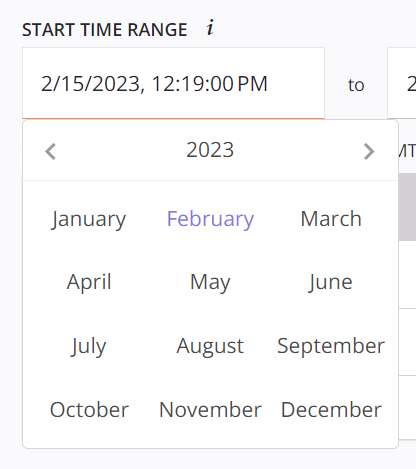
-
Day: Select the desired day from the calendar.
-
Time: Use the sliders to adjust the hour (top slider) and minutes (bottom slider).
Refresh
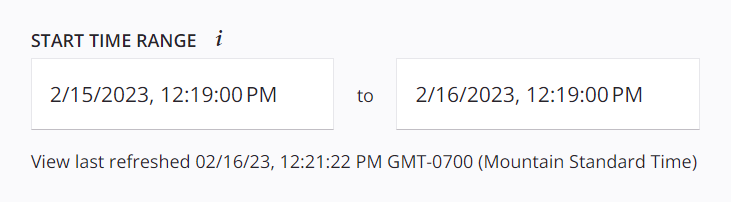
The initial logs are displayed based on the date and time that the last operation was run, as displayed at the top of the table. Logs are automatically refreshed every five seconds if any operation is still in a running state (status of Received, Submitted, Pending, or Running). The date and time that the view was last refreshed are reported below the Start Time Range:
You can also manually refresh the logs at any time to display updated information. To manually refresh the logs, click Refresh along the top right:

Status
The table can be filtered by operation status as described below. Operation step status is also listed in the table.
Operation status
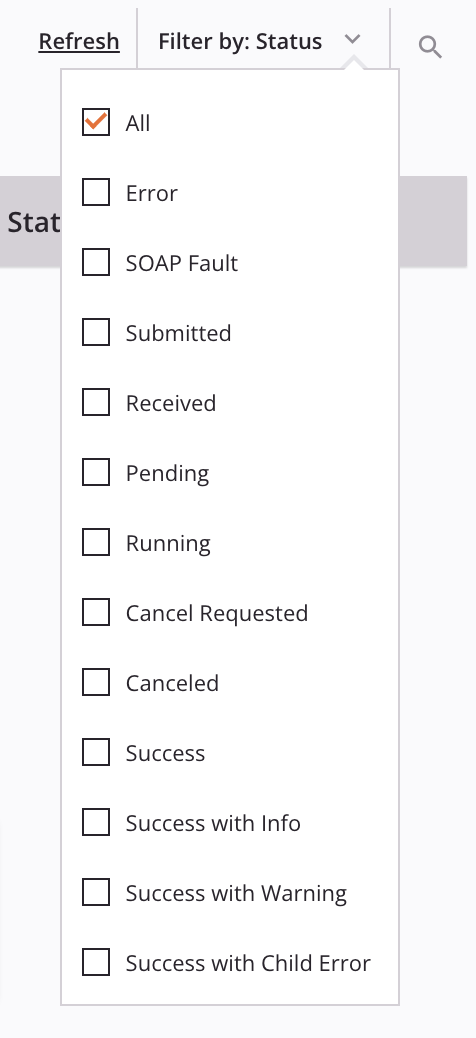
To filter logs by operation status, use the menu along the top right:
-
All: All operations are displayed regardless of status.
-
Error: If the agent completes the execution of an operation, but there was a fatal error in writing to the target system, or there was a fatal validation error in the transformation, or the transformation logic triggered the
RaiseErrorfunction, then the operation status is set to Error and the operation execution terminates. -
SOAP Fault: If the agent completes the execution of an operation, and the outcome was a SOAP fault, then the status is set to SOAP Fault. This status is applicable only for operations using Salesforce, Salesforce Service Cloud, ServiceMax, SOAP, or Workday activities.
-
Submitted: When operations are submitted to the Harmony queue, but have yet to be picked up by an agent for execution, they have a Submitted status. Operations can be submitted by several means:
- Jitterbit scheduling service or external scheduling service
- Manual execution of the operation in Cloud Studio
- A
RunOperationfunction from a script or transformation - Any tool, including
JitterbitUtils, that calls the Harmony API
-
Received: Once an agent is picked and the agent has acknowledged that it has received the request to run an operation, the status is changed to Received.
-
Pending: Once an operation is scheduled to run in an agent's operation engine, the status is changed to Pending. Operations should not be in Pending status for long durations, as agents should pick up the request and start running operations in a short amount of time.
-
Running: Once the agent starts executing an operation, the status should change to Running. Operations remain in this status until they complete or they encounter an error. The agent starts logging messages generated by the operation as it runs so that users can track which part of the operation is currently being executed.
-
Cancel Requested: Indicates that a request to stop the operation has been submitted. If a user wants to stop an operation that is in Submitted, Received, Pending, or Running status, they can do so from these locations:
- The operation (see operation status in Design canvas).
- The operation log table.
- The Runtime Operations page of the Management Console (see Canceling runtime operations).
Alternatively, they can enable another operation to cancel an operation using a combination of the
GetOperationQueueandCancelOperationfunctions. Once a cancel is requested, the operation status changes to Cancel Requested. An operation should not remain in this status for long, as the agent should cancel the operation in a fairly short period of time. -
Canceled: Once an agent cancels an operation, it sets the status to Canceled and the operation is terminated. All log information up to the point of cancellation is available for review in the log messages so you know at which point the operation was canceled.
-
Success: Once an agent completes the execution of an operation, if the outcome was a success without warnings from the target system, or warning written in the transformation using the
WriteToOperationLogfunction, then the status is set to Success. -
Success with Info: If the agent completes the execution of an operation, but there were non-fatal issues in the transformation or posting to the target system or the
WriteToOperationLogfunction was used to write messages to the log, then the status is set to Success with Info. This alerts the user to check for information in the log messages. -
Success with Warning: If the agent completes the execution of an operation, but there were non-fatal issues in the transformation or posting to the target system, and there was a warning, then the status is set to Success with Warning. This alerts the user to check for warnings in the log messages.
An
extra subelementwarning in the log messages can generally be ignored. This warning indicates a connector's API payload returned more nodes or fields of data than those defined in the response data schema. -
Success with Child Error: If the agent completes the successful execution of an operation, but within one or more child operations, there was a fatal error in writing to the target system, or there was a fatal validation error in the transformation, or the transformation logic triggered the
RaiseErrorfunction, then the operation status is set to Success with Child Error. This status does not apply to asynchronous operations. -
Delayed Status: If the agent does not return an operation log for any reason, Delayed Status is displayed. Harmony will attempt to fetch logs six times, with a 10-second timeout between each call. Refresh or check the logs again later. You cannot filter for operations with Delayed Status, but you can see them in the operation logs.
Operation step status
Operation steps appear only when that operation has operation debug logging enabled at the operation level (for cloud agents or for private agents) and the operation was run on a 10.48 or later agent.
Operation steps can have these possible statuses:
- Complete: The operation step was executed and completed without any errors.
- Error: The operation step was executed but could not be completed due to an error.
- Incomplete: The operation step was not executed or completed. Possible reasons for this status include that the operation step is waiting to be executed or that there was an error in a previous operation step preventing the following step from executing.
Search
Click the search icon ![]() to show a search box for entering keywords in the specified format to be searched for within the operation log screen.
to show a search box for entering keywords in the specified format to be searched for within the operation log screen.
A percent symbol (%) can be used as a wildcard at the beginning and/or end of a keyword.
By project or workflow
When viewing logs for the entire project or for a workflow, you can search by operation name or by message within the operation log screen:
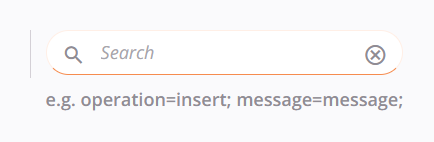
- Operation: Searches by operation name must be specified in the format of
operation=keyword. - Message: Searches by message must be specified in the format of
message=keyword.
Only a single operation keyword and single message keyword are supported. When both an operation keyword and a message keyword are provided, the keywords are treated as a combination; that is, operation logs are returned that match both the operation keyword and the message keyword.
By operation
When viewing logs for a single operation, you can search by operation log message only:
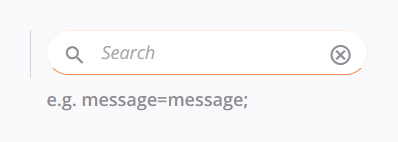
- Message: Searches by message must be specified in the format of
message=keyword.
Tip
For additional log search capabilities, you can also view logs through the Runtime Operations page of the Management Console.
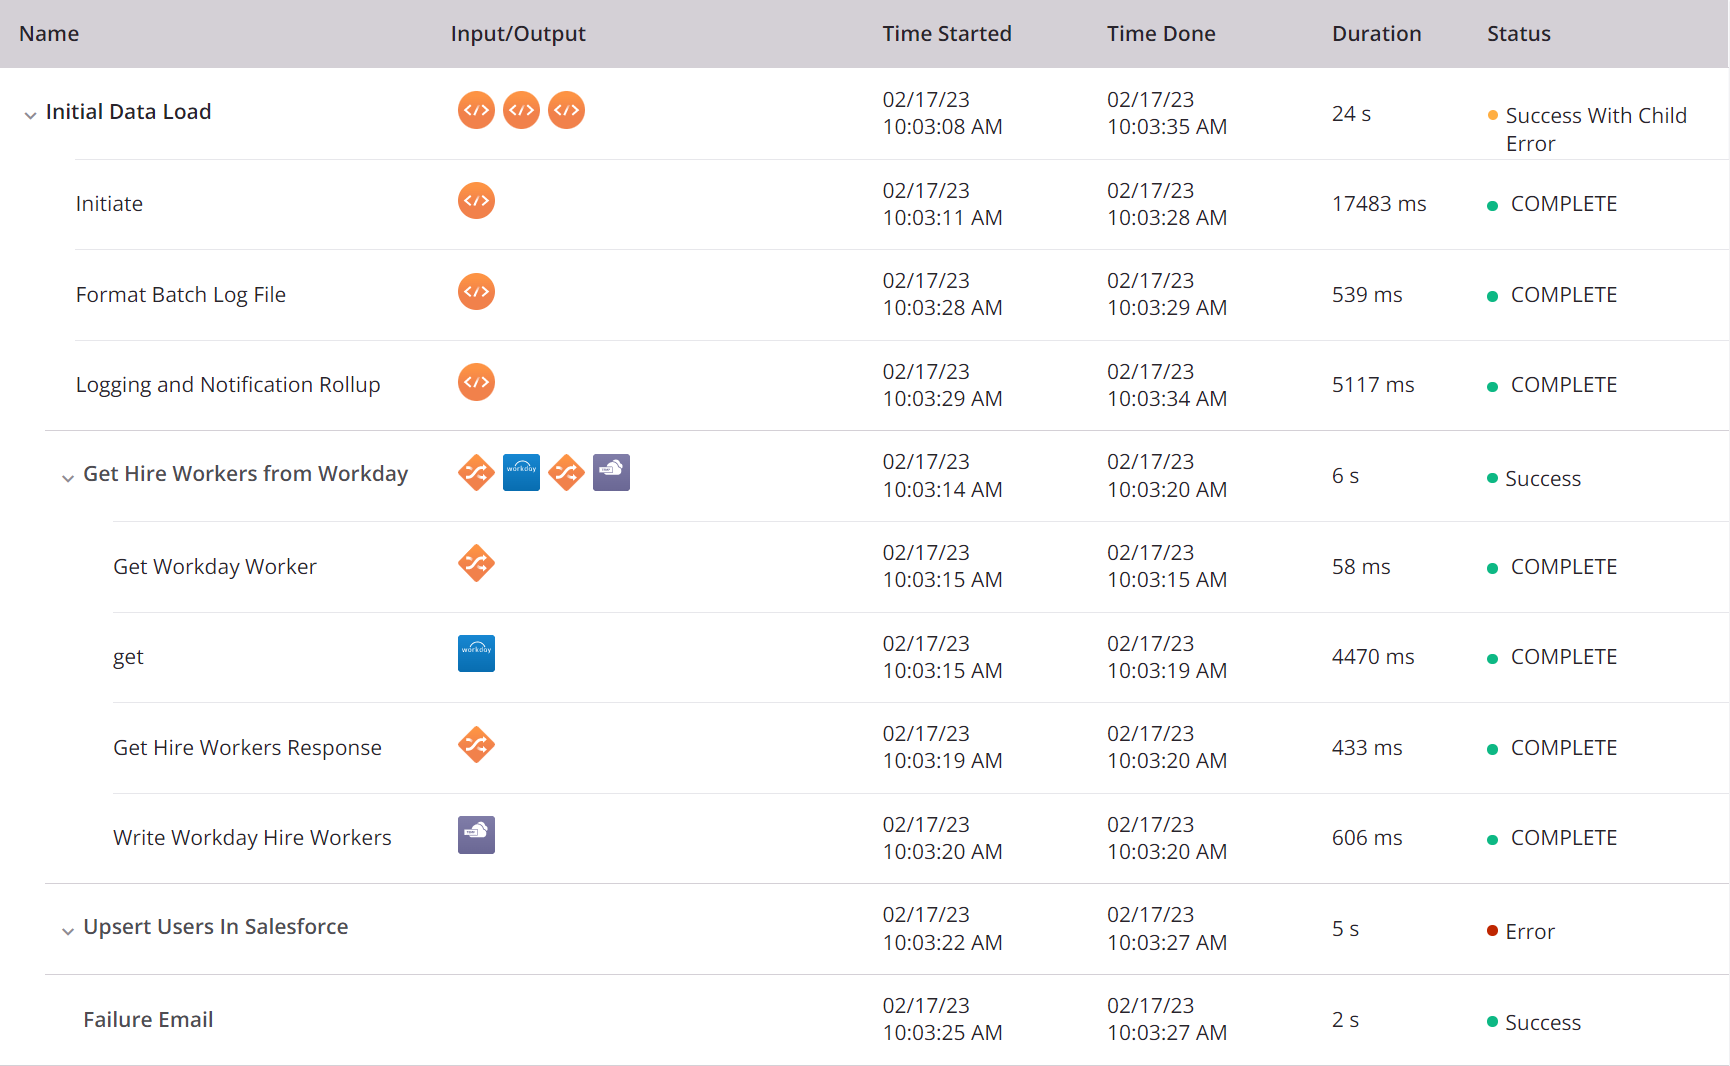
Operation log table
The operation log table displays the operation logs using the selected table controls. If operations are linked with operation actions, logs for downstream operations are also included.
Parent operations (and any child operations beneath them) are sorted in ascending order by Time Started. The table can be sorted (for top-level operations only) by Name, Time Started, Time Done, or Duration by clicking the respective header row.
A maximum of 250 operation rows are displayed. To view logs for additional operations, adjust the filters accordingly, or use the Management Console Runtime Operations page, which does not have the 250-log limit.
Tip
Basic configuration of what is included in an operation log is specified under the Options tab of the operation settings (see Operation options). See other logging options (for cloud agents or for private agents).
-
Name: The name of the operation or operation step. Disclosure triangles

 , which can be used to expand or collapse additional rows, are shown on parent operations and on operations for which component input and output data are available:
-
Parent Operations: When a parent operation is expanded, additional rows for its child operations appear in the order in which they were executed.
-
Operation with Input and Output Data: When an operation with input and output data is expanded, additional rows for each operation step appear in the order in which they were executed. More information is provided under Component input and output data.
-
-
Input/Output: This column is displayed only when the table contains an operation that has operation debug logging enabled at the operation level (for cloud agents or for private agents) and the operation was run on a 10.48 or later agent. Input and output data accessed through this part of the log table is described under Component input and output data.
-
Time Started: The date and time the operation or operation step began running, displayed as the local browser time.
-
Time Done: The date and time the operation or operation step stopped running, displayed as the local browser time.
-
Duration: The time elapsed between Time Started and Time Done, reported in seconds for operations and in milliseconds for operation steps.
-
Status: The status of the operation or operation step. For a complete list of possible statuses, see Status earlier on this page.
-
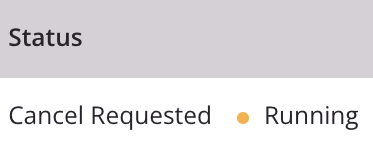
Cancel: For operations that are in Submitted, Received, Pending, or Running status, a Cancel button is displayed next to the status:

Click Cancel to send a request to the agent to stop the operation. Clicking Cancel sends a request to the agent to stop the operation and a Cancel Requested status is displayed next to the real-time operation status:
Note
Operations that have a Cancel Requested status may still run.
-
Operation Log: To show or hide a log for an individual operation, click anywhere on an operation row except on the icons shown in the Input/Output column (if present):
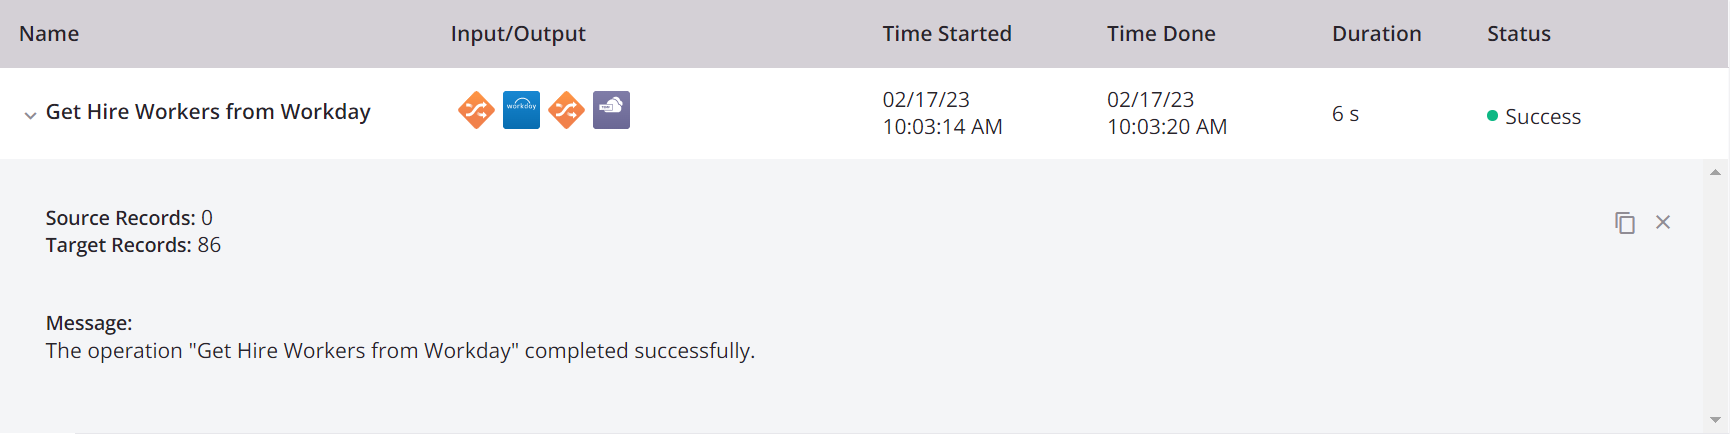
-
Source Records: A count of records that have been read from the source system.
-
Target Records: A count of records that have been posted to the target system.
-
Log Messages: Log messages include the log details for the selected operation. Whether log messages are displayed depends on the current user's permissions and access levels and whether cloud logging is enabled. For more information, see the section Log messages in the Management Console Runtime Operations page documentation.
Under certain circumstances, a Try Again button may be displayed, covered in Operation retry, below.
Note
Dates and times displayed within the log messages themselves are not converted to local browser time, but are reported in their original format from the source of the log message.
-
Copy: Click the copy icon
 to copy the log data to your clipboard. When clicked, a clipboard icon
  is temporarily displayed.
 -
Close: Click the close icon
 to hide the operation log.
-
Component input and output data
Component input and output data is generated when an operation has operation debug logging enabled at the operation level (for cloud agents or for private agents) and the operation was run on a 10.48 or later agent.
Note
The generation of component input and output data is unaffected by the agent group setting Enable Cloud Logging (see Agents > Agent groups). Component input and output data will be logged to the Harmony cloud even if cloud logging is disabled.
To disable generation of component input and output data in a private agent group, in the Private agent configuration file under the [VerboseLogging] section, set verbose.logging.enable=false.
Warning
When component input and output data are generated, all request and response data for that operation are logged to the Harmony cloud and remain there for 30 days. Be aware that personally identifiable information (PII) and sensitive data such as credentials provided in a request payload will be visible in clear text in the input and output data within the Harmony cloud logs.
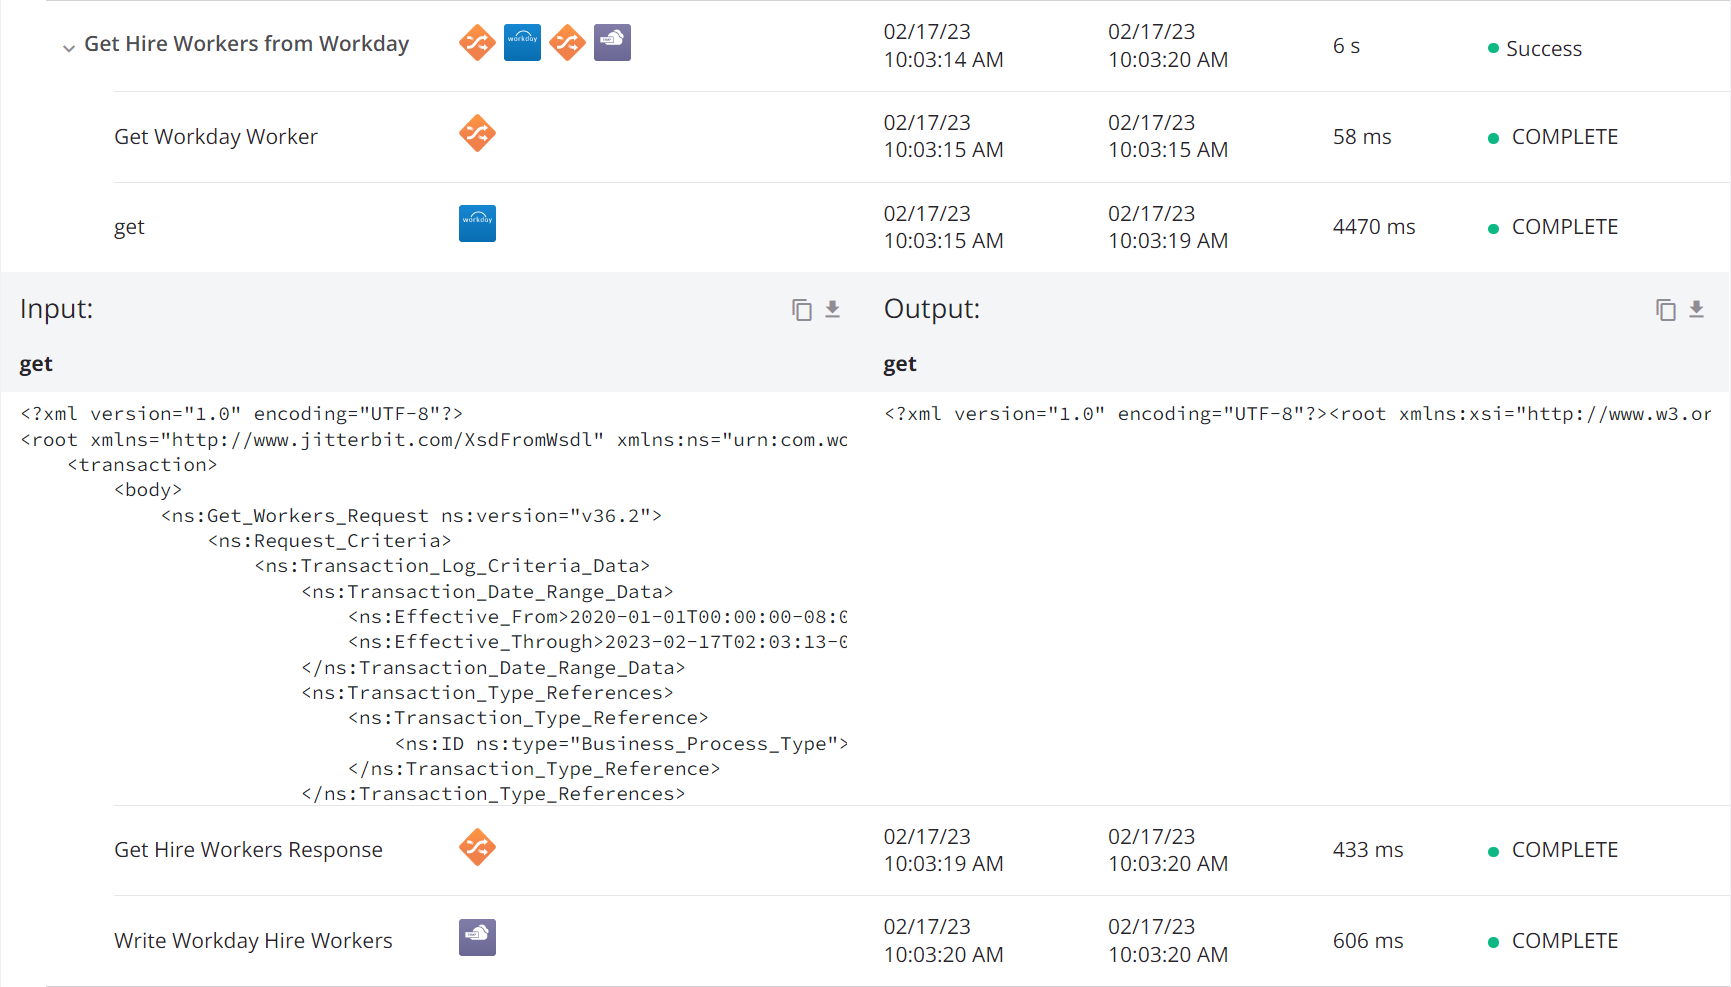
When component input and output data is present, an Input/Output column showing a graphical representation of the operation or operation step is displayed in the operation log table.
In the Input/Output column, icons for activities and transformations used as operation steps can be clicked to show or hide the component input and output data for that individual operation step. Each input and output log entry is limited to 100MB. If the data for an individual input or output log entry exceeds 100MB, no data will be displayed.
-
Copy: Click the copy icon
to copy the log data to your clipboard. When clicked, a clipboard icon is temporarily displayed. -
Download: Click the download icon
 to download the input or output data as a file in the appropriate data format. The file is named with the operation step name followed by
 _inputor_outputas appropriate.
Operation retry
If an operation fails with an error related to file dependencies, this issue may be resolved by resyncing the project between the agent and Harmony. In this scenario, a Try Again button appears in the operation log:
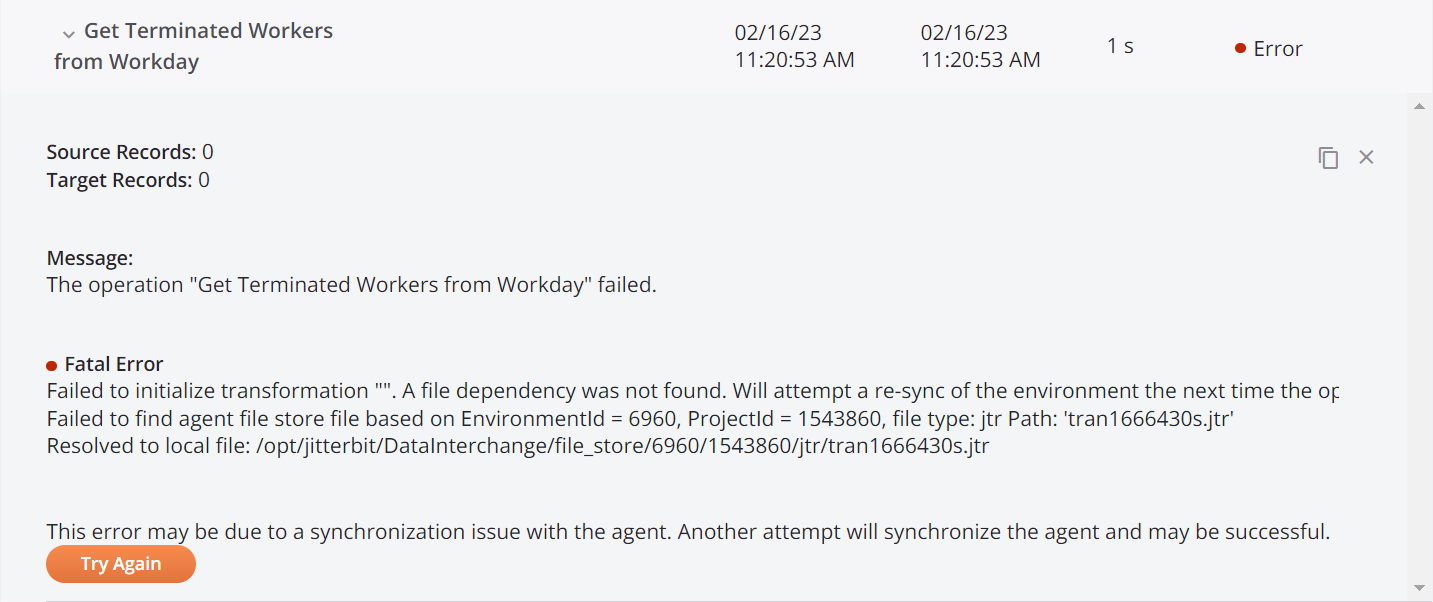
On clicking Try Again, the project is resynced between the agent and Harmony.
After the resync is complete, the operation run is automatically retried. In cases where a parent or child operation failed, the entire operation chain is retried from the top level down to all downstream operations.
If successful, a success status is displayed in the new operation log. If the operation again fails, additional attempts to synchronize the agent won't help and the reason for the failure may be due to something else (contact Jitterbit support for assistance).