Script testing
Introduction
Test mode offers basic debugging functionality where you can test the results of a script by entering values to test as input to the script.
Be aware that depending on the contents of a script, sometimes a script can fail when testing but still run successfully when deployed and executed on an agent. This may happen if, for example, you do not have a default value set for a global variable that obtains its value when running.
The script used for testing has a size limitation of 51200 bytes. This limit does not apply beyond testing.
Use breakpoints
In Jitterbit Scripts, you can use the function DebugBreak, which acts as a breakpoint for the script execution. When a script is tested, the Jitterbit Script engine stops execution when it reaches a call to DebugBreak. It sends back information about the current state to the client, including the values of all data elements, both source data elements and global data elements. This provides a powerful way to test the logic you put in the script.
The function DebugBreak optionally accepts a boolean value. If true, execution breaks at the statement when testing. If false, the breakpoint is ignored when testing. This allows you to set up sophisticated testing scenarios that are controlled by input variables, allowing you to test parts of a script depending on settings. For more information on how to use DebugBreak, see Debugging functions.
In JavaScripts, you can see and validate the values of variables just as you would for Jitterbit Scripts. However, debugging is not available in JavaScript and using breakpoints is not supported.
Run a test
Within a script, use the toggle in the top right to select Test mode:
Then click the Test button to run a test:

Caution
If a script calls other project components that have not yet been deployed or have been changed since last being deployed, a message lists those components that must be deployed before you can test the script (see Project deployment).
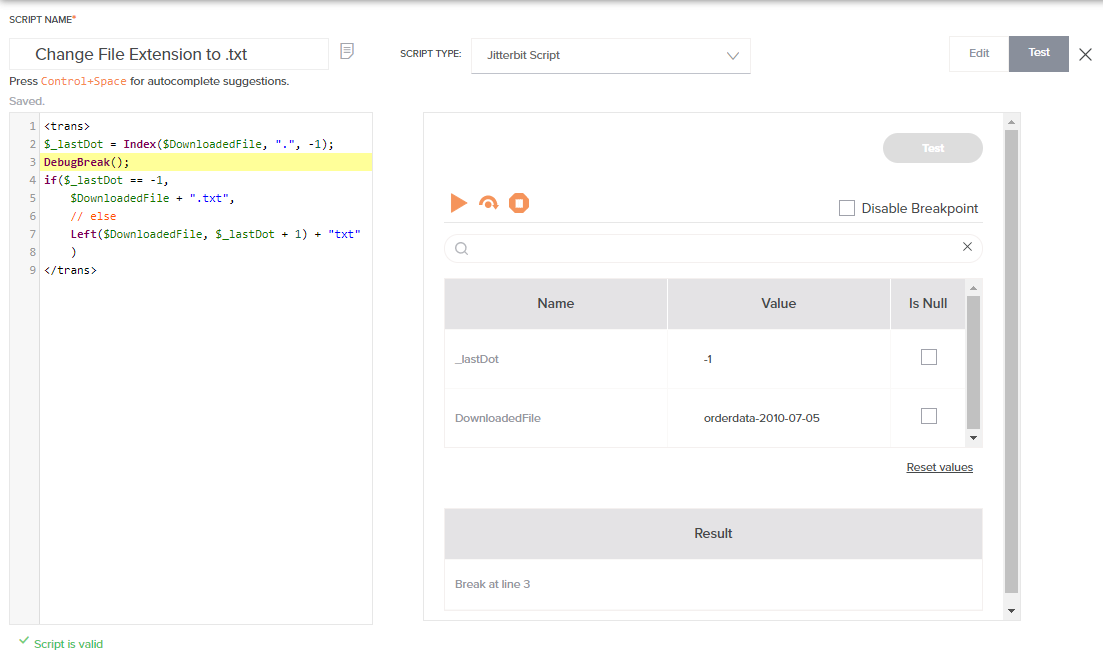
When running a test, this information is displayed in the table:
-
Name: The name of each global variable, project variable, or Jitterbit variable used in the script (Local variables are not included).
-
Value: The current value of the script variable. When the script is not running, you can edit the value of a variable.
-
Set Null: When the script is not running, you can use this flag to set the value to null.
When a test is started or resumed, any new values are sent back to the script engine.
You can walk through the debugging process using the controls along the top of the table:
| Control | Description |
|---|---|
| Resume: When the test is stopped, this resumes the test. The test runs until it either comes to another breakpoint or until it has completed. | |
| Next: When the test is stopped, this runs only the next statement of the script. This allows you to step through the script line by line. | |
| Stop: This stops the current test. |
You also have the option to toggle off breakpoints. Select the checkbox to Disable Breakpoint if you want the test to ignore all calls to DebugBreak and instead run to completion. This option is applicable for Jitterbit Scripts only.
To search for a particular variable by name, use the search box to enter a keyword or multiple keywords separated by commas. Variables that have any part of the keywords in the variable name are returned.
To reset all values, click the Reset Values link below the table.
Finally, the Result is shown in second table that appears below the first:
- Jitterbit Script: The Result table displays the resulting output of the last statement of the script (if no breakpoints are present), or the resulting output after each breakpoint.
- JavaScript: The Result table displays the results of the script as set by either the
SetScriptOutputorSetScriptResultfunctions.
In addition, any error messages incurred during the testing are also displayed.