Debug the formula builder
The Formula Builder offers basic debugging functionality through the use of the special function DebugBreak, which acts as a breakpoint for the script execution.
When a script or mapping is tested, the Jitterbit script engine stops execution when it reaches a call to DebugBreak. It sends back information about the current state to the client, including the values of all data elements, both source data elements and global data elements. This provides a powerful way to test the logic you put in the script.
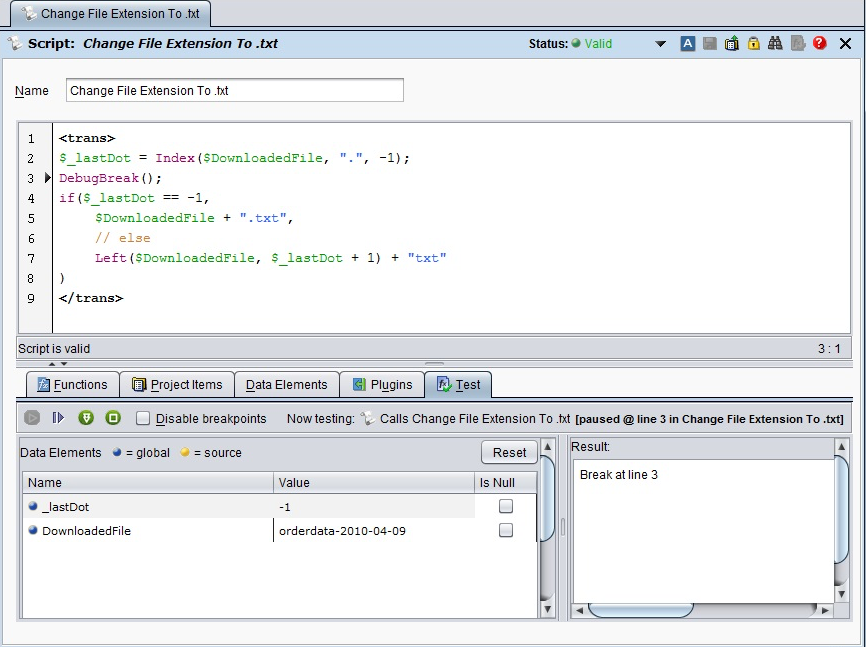
When running a test, the Formula Builder automatically switches to the Test tab (see screenshot below). Here you can see the current values of all script variables, in the Data Elements table. When stopped at a breakpoint you can also change the value of a variable by clicking in the Value column. The new value you entered is sent back to the script engine when the test is resumed. The value and type of a variable is also displayed in a popup if you hover over the name of the variable in the expression area.
You can also control the debugging process through a row of buttons in the Test tab's toolbar. From left-to-right, these buttons are:
-
 Start testing: Starts a new test. This button is disabled if a test is already running.
 -
 Resume the current testing session:** When the test has stopped at a breakpoint, clicking this button resumes the test. The test will run until it either comes to another breakpoint or until it has completed.
 -
 Run next statement in the current test:** When test has stopped at a breakpoint, click this button runs only the next statement of the script. This allows you to step through the script line by line.
 -
 Stop the current testing session:** This stops the current test.
 -
 Disable breakpoints:** Select this check box if you want the test to ignore all calls to
 DebugBreakand instead just run to completion.
Only one test can be run at the time. If you attempt to start a new test while another test is running, you will receive an error message that prompts you to first stop the current test. The current test can be stopped from the Test tab, or from the top-level Actions menu in the main window (Actions > Stop Current Test).
The DebugBreak function is only called when you perform a test of an operation, transformation, or script. When the script is executed outside of a test (such as in production), the script engine ignores DebugBreak; DebugBreak calls do not need to be removed from scripts in production code.
This screenshot shows the Test tab, with a script stopped at a breakpoint. Note how the location of the breakpoint is marked by a small arrow in the left-side margin of the expression area:
DebugBreak optionally accepts a Boolean value. If true, execution will break at the statement when testing. If false, the breakpoint will be ignored when testing. This allows you to set up sophisticated testing scenarios that are controlled by input variables, allowing you to test parts of your script depending on settings.