Review an operation log in Jitterbit Design Studio
Overview
Every time an operation is executed, the outcome is recorded in the Operations Log. The Operations Log screen displays a list of successful, unsuccessful, or partially successful activities related to a particular operation.
Important
By default, successful API operations (configured for custom APIs or OData services) are not included in the operation logs unless one of these settings is enabled:
EnableLogging=true in the [APIOperation] section of the private agent configuration file. There are several ways to open an operation log:
-
In the Integration hierarchical tree, right-click on the desired operation and select Operation Log from the sub-menu.
-
If you are viewing the operation, click the Show Log icon in the operation's toolbar in the upper right corner of the screen.
The log displays in its own Operations Log tab.
-
Click the Refresh button to download the latest logged information from the Jitterbit Management Console.
-
The complete log summary is loaded into the upper pane, including the time an operation was executed and the specific outcome of the operation. The operation may successfully complete, partially complete, i.e. some of its data was not processed correctly, or it may fail.
-
Click on any entry in the list to load more information pertaining to the outcome of that instance of the operation running. The information loads in the lower pane.
-
Details may include whether there were any problems associated with the process, the probable cause, and the location in the operation where the problem occurred.
-
Operations that partially complete typically provide a link to the data that did not process correctly with an error message as to why the data was not processed.
-
Operations that result in a SOAP fault display an orange exclamation mark.
-
Failed operations generally give the reason why the operation failed to process altogether.
Log for a chained operation
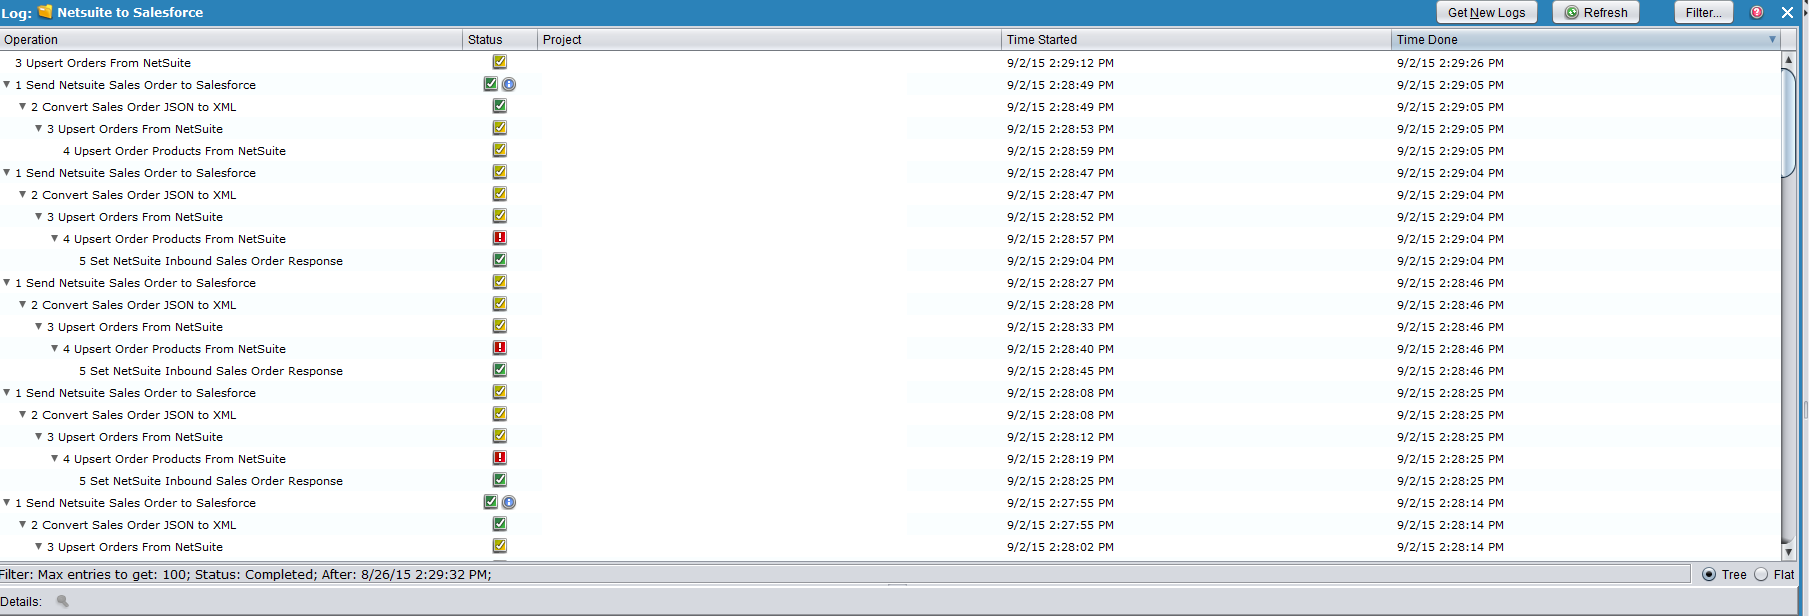
In the Operation Log, a chained operation is represented by indents in the Operation column:

This feature of Jitterbit logs is useful in two ways:
-
It helps you easily identify the subordination of elements in the chain.
-
In case of failure, you can readily pinpoint the cause where it occurs in the chain.