Runtime Operations
Introduction
The Runtime Operations page is a table of operation logs. The logs give information about Cloud Studio and Design Studio operations running in a selected organization's environments:
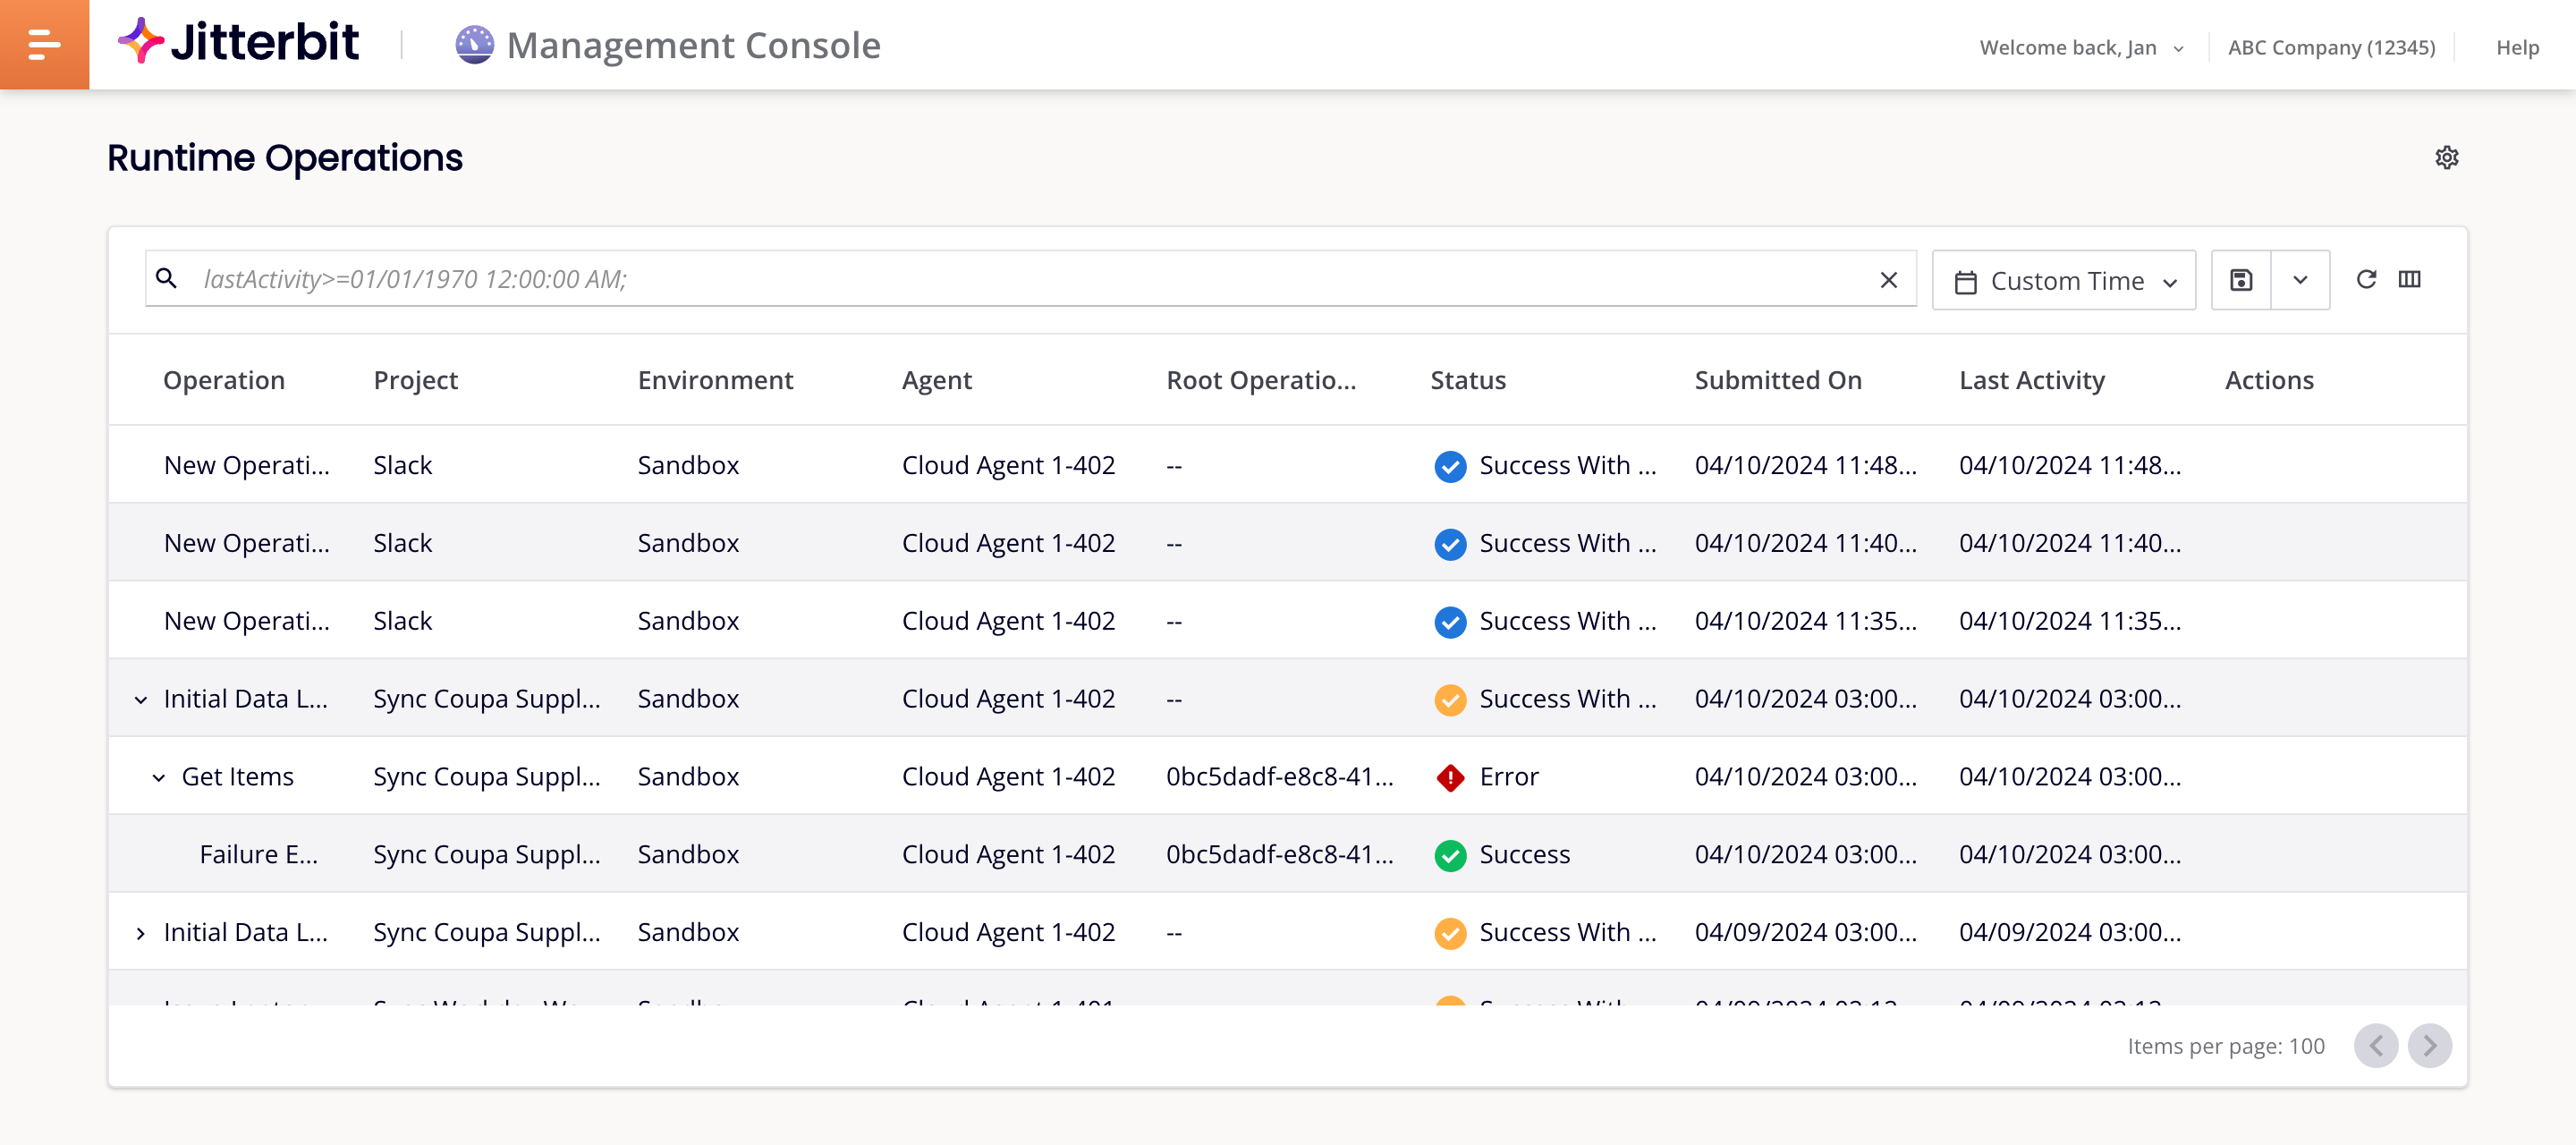
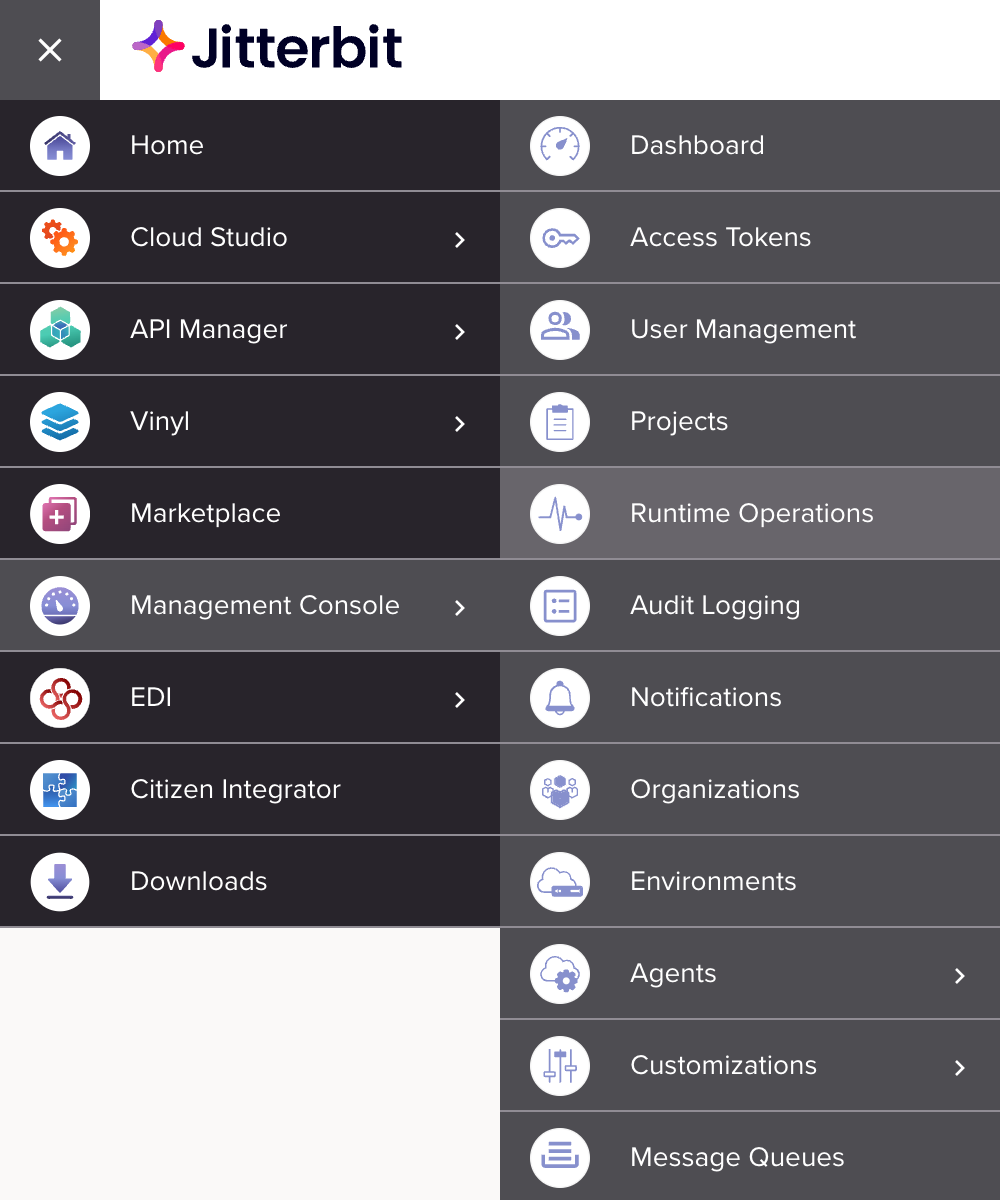
To open the Runtime Operations page, select Management Console > Runtime Operations from the Harmony Portal menu:
To access this page, you must be either a Harmony organization administrator (a member of a role with the Admin permission), or a member of a role with Execute or View Logs environment access.
On the Runtime Operations page, you can do the following:
-
View the details of running operations, and, if you're an organization administrator, cancel incomplete operations. (You can also view operation logs on the Cloud Studio operation logs and Design Studio operation logs pages.)
-
Filter operation logs using a query or a time range, and save, use, edit, or delete queries.
-
Change the table's view settings: rearrange the table's columns, and change the automatic table refresh period.
Harmony keeps operation logs for 30 days.
By default, the Runtime Operations page does not show successful Custom API or OData services API operations. To include them, enable operation debug logging on the operation, or, for private agents only, set EnableLogging=true in the [APIOperation] section of the private agent configuration file.
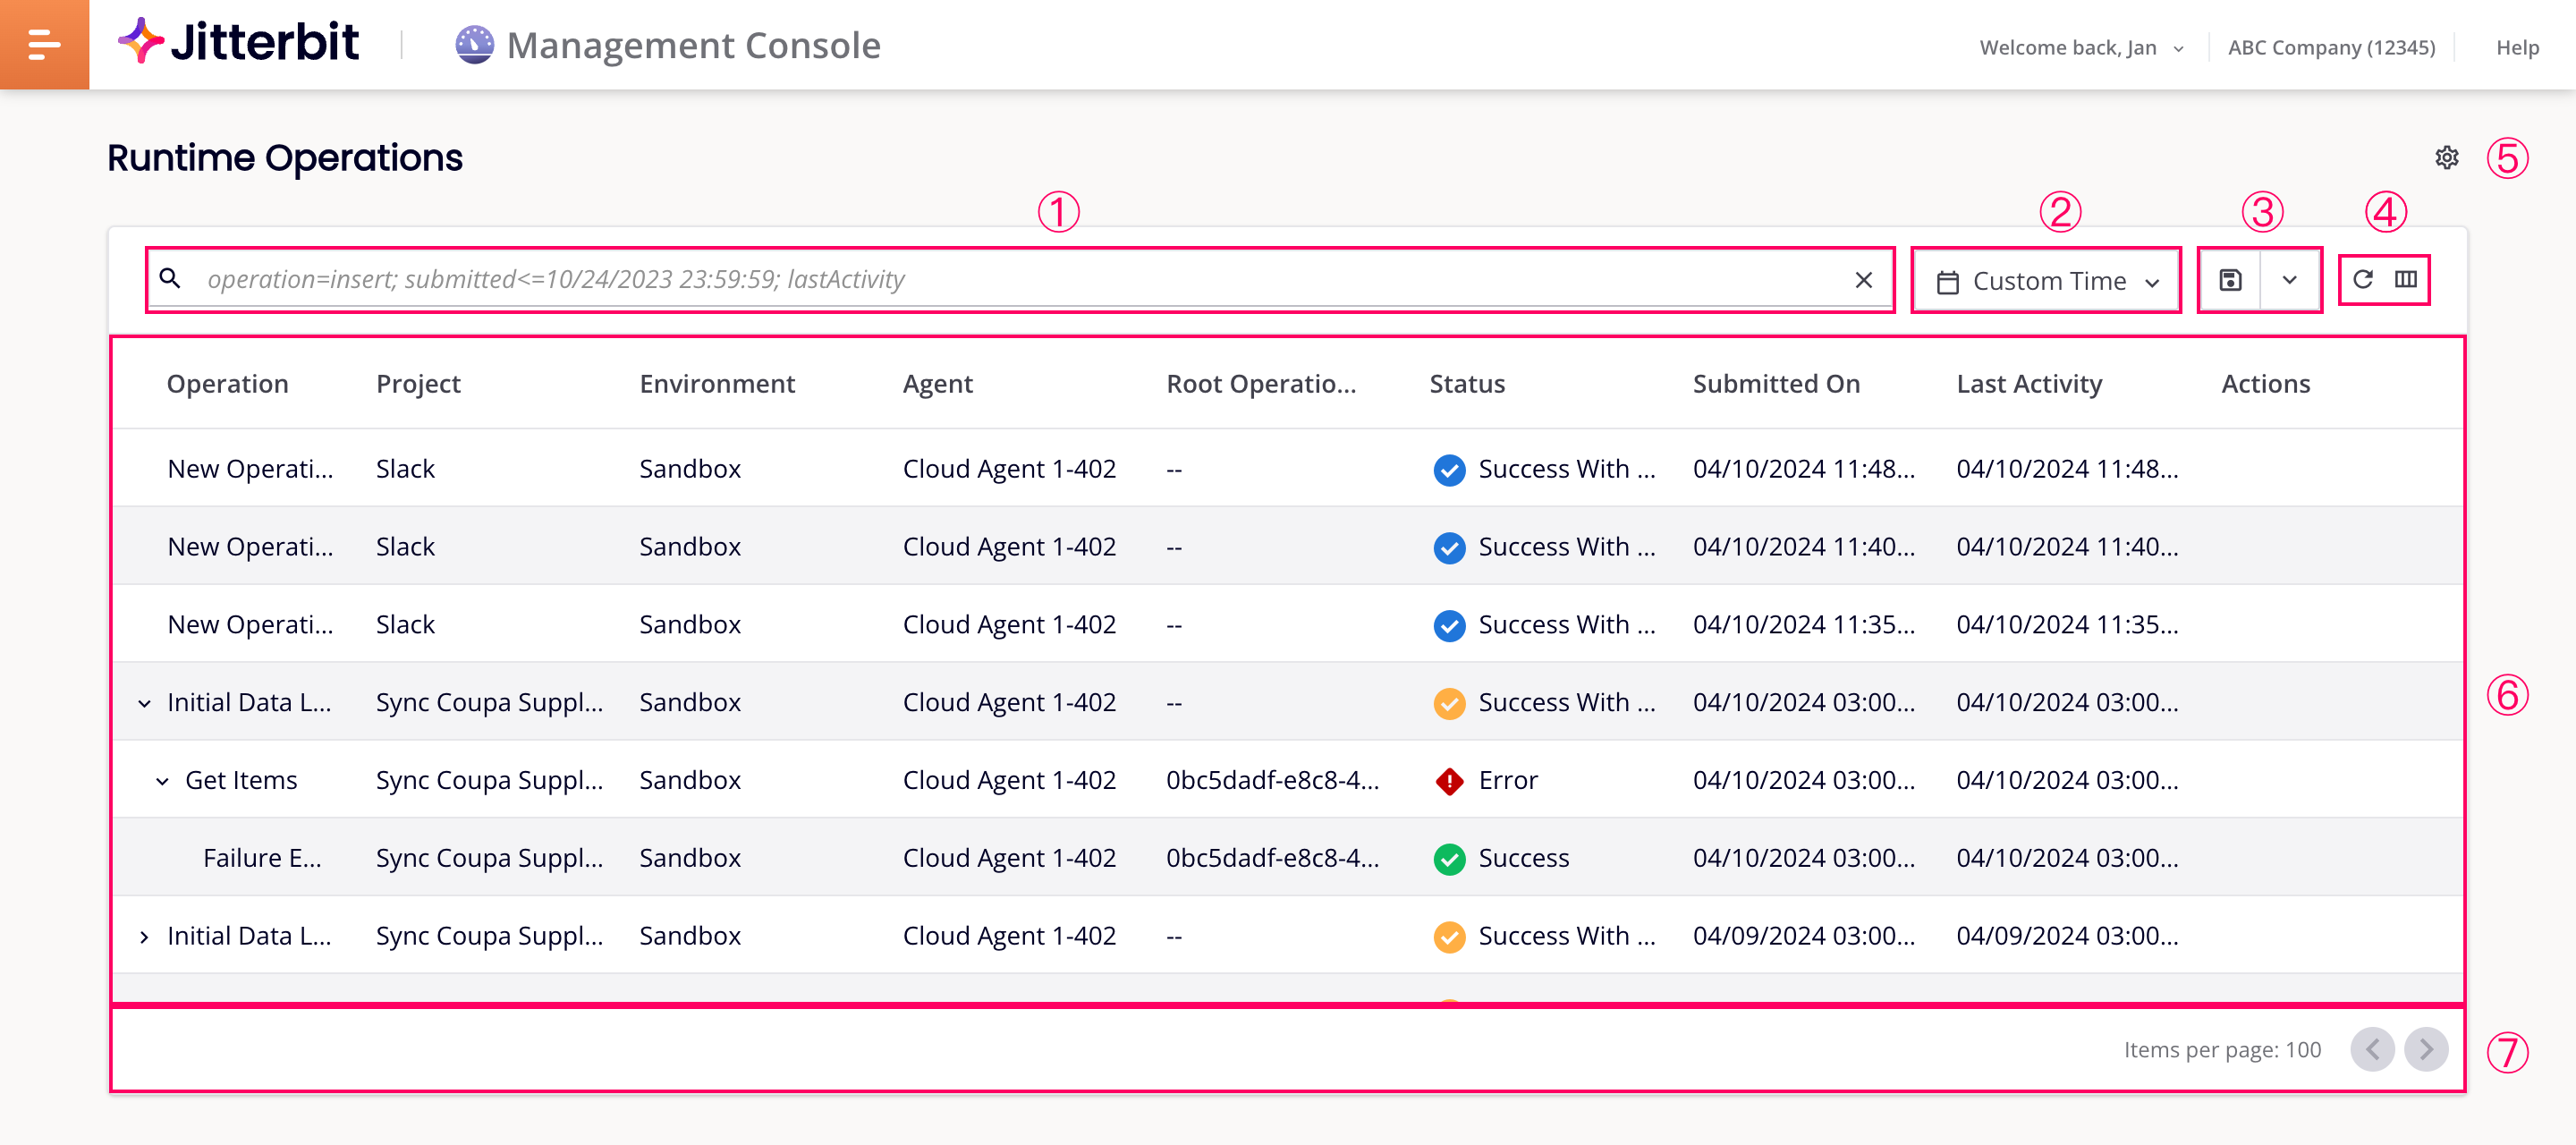
The page's tools and regions are mentioned throughout this document. They are identified in the image below:
Legend
① Search bar
② Time range menu
③ Save Query and Saved Queries icons
④ Table refresh and Filter Columns icons
⑤ Page settings icon
⑥ Operation details table
⑦ Paginator tools
Operation details table
The default table columns arrangement is as follows:
- Operation: The name of the Cloud Studio or Design Studio operation. If an operation has children, click the Expand icon to reveal the entire chain. Click a Minimize icon to collapse an operation and its children.
- Environment: The name of the environment the operation was deployed to.
- Agent: The agent name.
-
Root Operation Instance Guid: (Beta) The globally unique identifier (GUID) of the operation's root (top-level) operation. This field is empty for root operations, and the column is hidden by default. To copy the value, hover on it, then click Copy content.
Note
Root Operation Instance Guid is a beta feature that will be developed further in the future.
-
Status: The status of the operation, one of the following:
- Submitted: An operation was submitted to the Harmony queue, but has not yet been accepted by an agent for execution.
- Received: An agent acknowledges receiving the request to run an operation.
- Pending: An operation is queued to run on an agent.
- Running: An agent is executing the operation.
- Cancel Requested: A request to cancel the operation has been made. Operations may show this status yet continue to run after canceling.
- Canceled: The operation was canceled.
- Success: The operation completed successfully.
- Success With Info: The operation completed successfully with non-fatal issues.
-
Success With Warning: The operation completed successfully with warnings as shown in the log messages.
An
extra subelementwarning in the log messages can generally be ignored. This warning indicates a connector's API payload returned more nodes or fields of data than those defined in the response data schema. -
Success With Child Error: The operation completed successfully, but one or more child operations suffered fatal errors. (Applies to synchronous operations.)
- Error: The operation failed.
- Soap Fault: The operation failed with a SOAP fault. (Applies to operations with Cloud Studio SOAP or Salesforce endpoints, or Design Studio web services or Salesforce endpoints.)
- Submitted Date: The time the operation run was requested.
- Last Activity: The time the operation's status last changed.
-
Actions: Hover on an operation to reveal the following actions:
-
Cancel Operations: Stop an operation that is in Submitted, Received, Pending, or Running status.
-
Go to operation: Open the project in Cloud Studio, and select the operation.
-
When there are more than 100 operations, they are split into pages of 100 each. You can move through them using these navigation buttons at the bottom of the table:
- Previous Page: Go to the previous page.
- Next Page: Go to the next page.
To see an operation log's details, select one in the table. A drawer opens at the bottom of the window with three tabs, Messages, Activity Logs, and Debug Files.
Messages tab
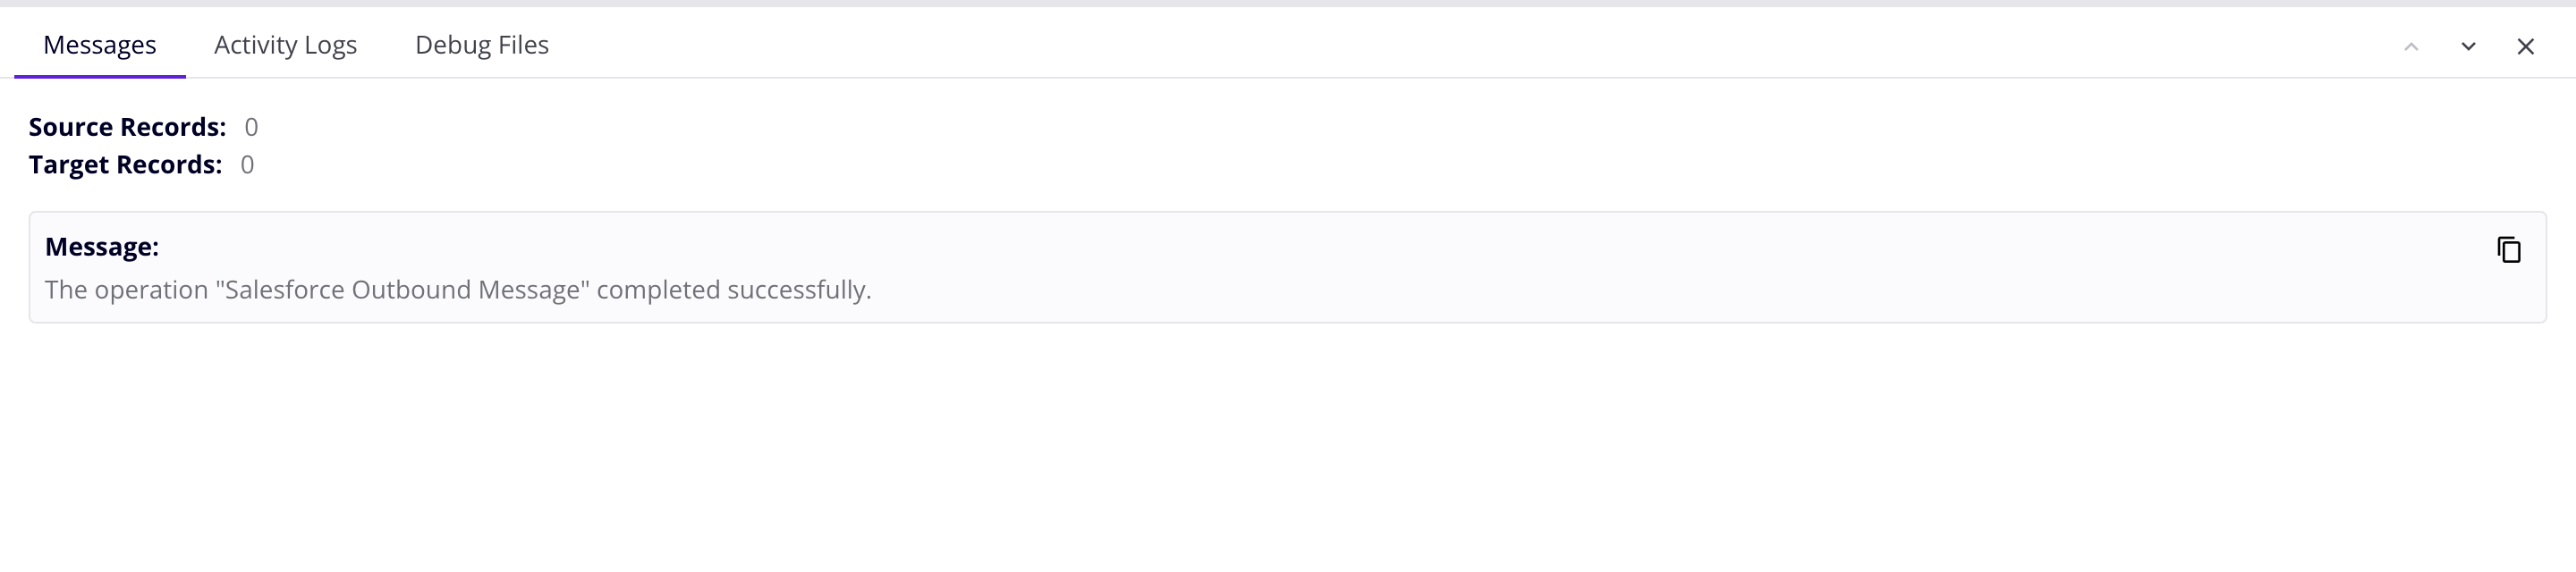
This tab shows the following:
- Source Records: The number of records read from the source system.
- Target Records: The number of records posted to the target system.
- Message: Log details including any of the following:
- System-generated messages indicating that the operation completed without error.
- Information and warning messages returned by either the source or target systems.
- Validation warnings returned by the Jitterbit transformation, validation, and scripting services.
- User-defined messages generated by the
WriteToOperationLog()function.
To see an operation's log messages in the Messages tab, the following must be true:
- You must be a member of a role with a minimum of Read organization permission and Execute environment access. (An environment access level of View Logs is not sufficient.)
- Cloud logging is enabled on the private agent group. (Cloud logging is always enabled on cloud agent groups.) When disabled, and if your network configuration lets you connect directly to the agent host, log messages can be viewed securely by clicking the link View log messages from Agent.
Activity logs tab
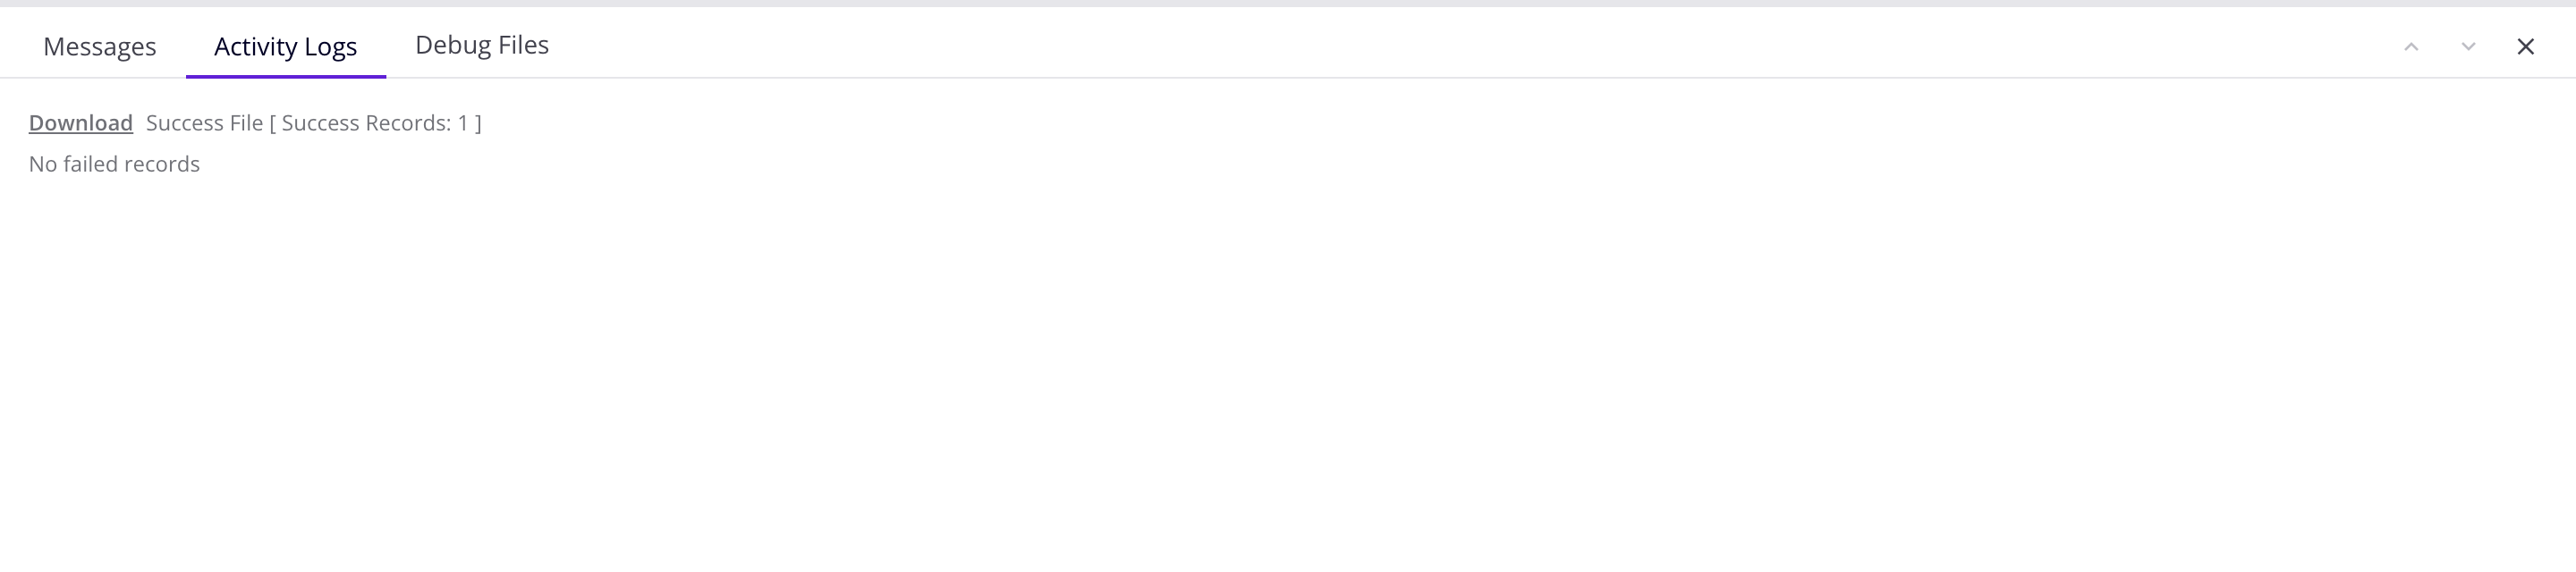
This tab contains links to success or failure files created by the Salesforce, Salesforce Service Cloud, or ServiceMax activities running on a private agent.
The files are in CSV format. To download one, click on its link.
Activity log files are automatically deleted after 14 days by the private agent's file cleanup service. You can change this behavior in the [ResultFiles] section of the private agent jitterbit.conf file, or by changing the file cleanup service rules.
Activity log downloads are disabled for cloud agents. You may see download links for cloud agent activity logs, but any attempt to download logs generates an error message.
Debug files tab
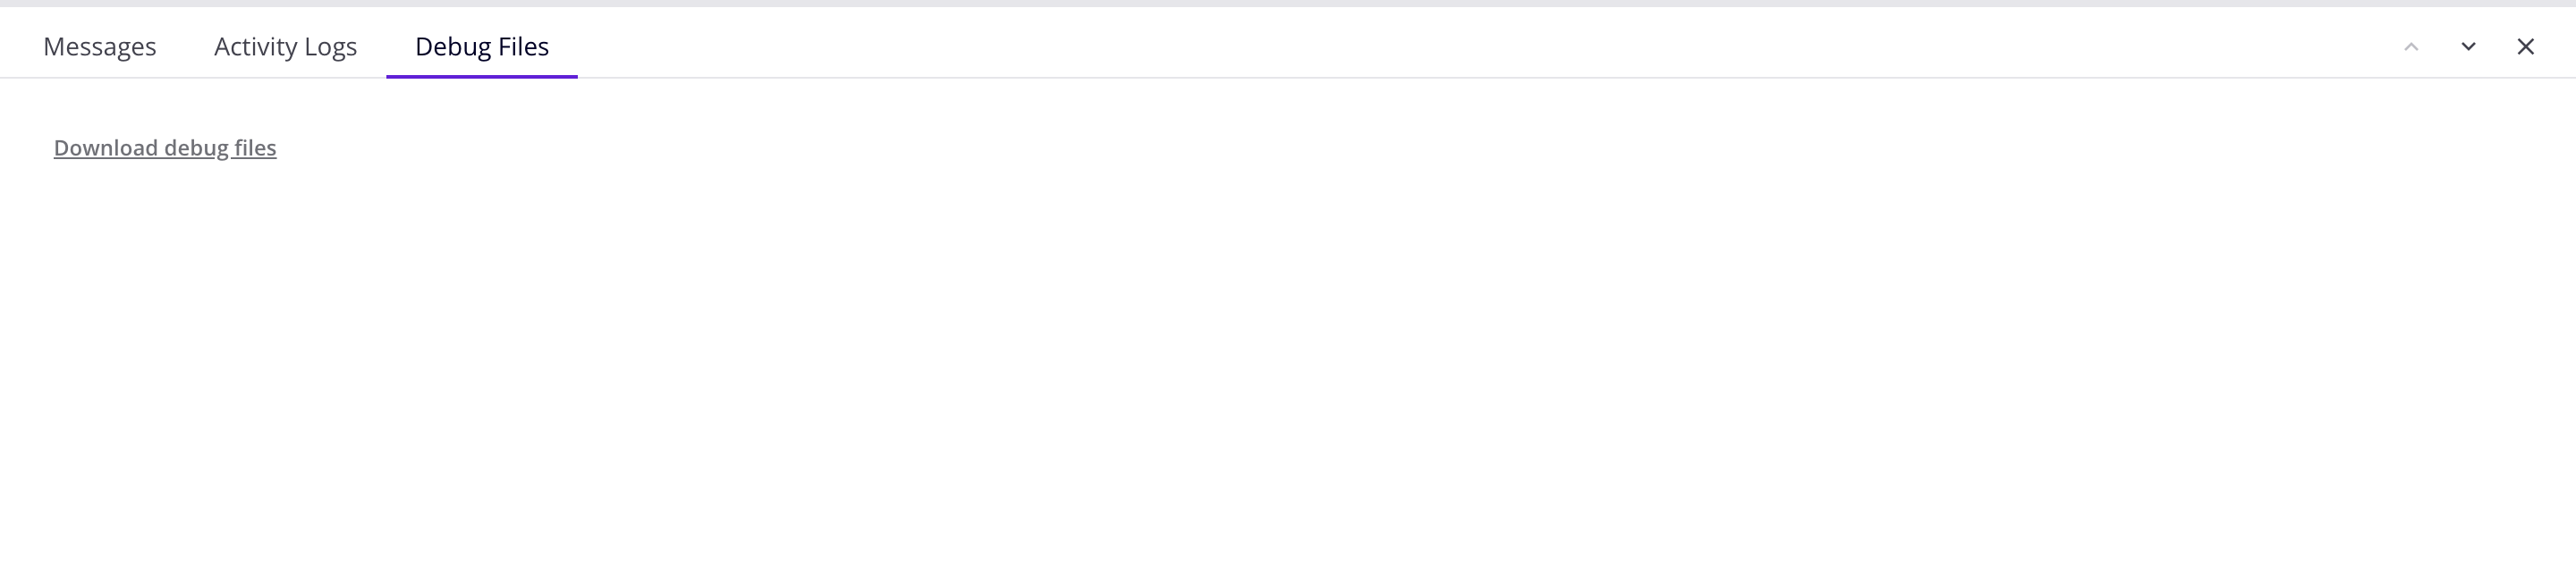
This tab contains links to debug log files. When enabled, these are generated for all operations running on a private agent, or for selected Cloud Studio or Design Studio operations running on any agent type.
Queries
A query is one or more key/value terms. Multiple terms are separated by semicolons. A term has the form <key><operator><value>. For the operation, project, environment, agent keys, values can include a wild card character, %, which matches any string.
To use a query, enter a valid query specification in the search bar then press return:

The following table shows the available query term components:
| Key | Key column | Allowed Operators | Value1 |
|---|---|---|---|
operation | Operation | = | Operation name |
project | Project | = | Project name |
environment | Environment | = | Environment name |
agent | Agent | = | Agent name |
status | Status | = | Status name |
submitted | Submitted On | <= | Date/time |
>= | |||
lastActivity | Last Activity | <= | Date/time |
>= | |||
rootOperationInstanceGuid | Root Operation Instance Guid | = | Root operation's GUID |
1 Value types
- Status name: The string shown in the Status column of the operation details table.
- Date/time:
month/day/yeardate format, with optionalhour:minute:secondtime in AM/PM form:- Date only:
MM/DD/YYYY - Date and time (AM):
MM/DD/YYYY HH:MM:SS AM - Date and time (PM):
MM/DD/YYYY HH:MM:SS PM
- Date only:
Query examples
The following are example query terms:
| Query term | Description |
|---|---|
operation=New Delete; | Show the "New Delete" operation. |
operation=New%; | Show operation logs for operations with names that begin with "New". |
project=SFDC-SAP; | Show operation logs for operations in the "SFDC-SAP" project. |
project=SFDC%; | Show operation logs for operations in any projects with names beginning with "SFDC". |
environment=DEnv; | Show operation logs for operations deployed in the "DEnv" environment. |
environment=DE%; | Show operation logs for operations deployed to environments with names beginning with "DE". |
agent=Windows%; | Show operation logs for operations running on agents with names beginning with "Windows". |
status=success; | Show operation logs for operations with status "SUCCESS". |
submitted>=9/12/2024; | Show operation logs for operations submitted on or after 9/12/2024. |
submitted>=9/12/2024 11:59:00 AM; | Show operation logs for operations submitted on or after 11:59 on the morning of 9/12/2024. |
lastActivity<=10/04/2024; | Show operation logs for operations last active on or before 10/04/2024. |
lastActivity>=10/04/2024 01:00:00 PM; | Show operation logs for operations last active on or after 10/04/2024 at 1 PM. |
message=1201 alarm; | Show operation logs for operations containing the message string "1201 alarm". |
rootOperationInstanceGuid=0f04b6f6-4129-45dd-8388-abd19fe6a4f7; | Show operation logs for operations that are children of the root operation with the GUID shown. |
Note
Dates are specified and displayed in your browser's time zone.
Saved queries
Queries can be saved and used, then edited or deleted, as follows:
-
To save a query, click Save query. The query form opens:
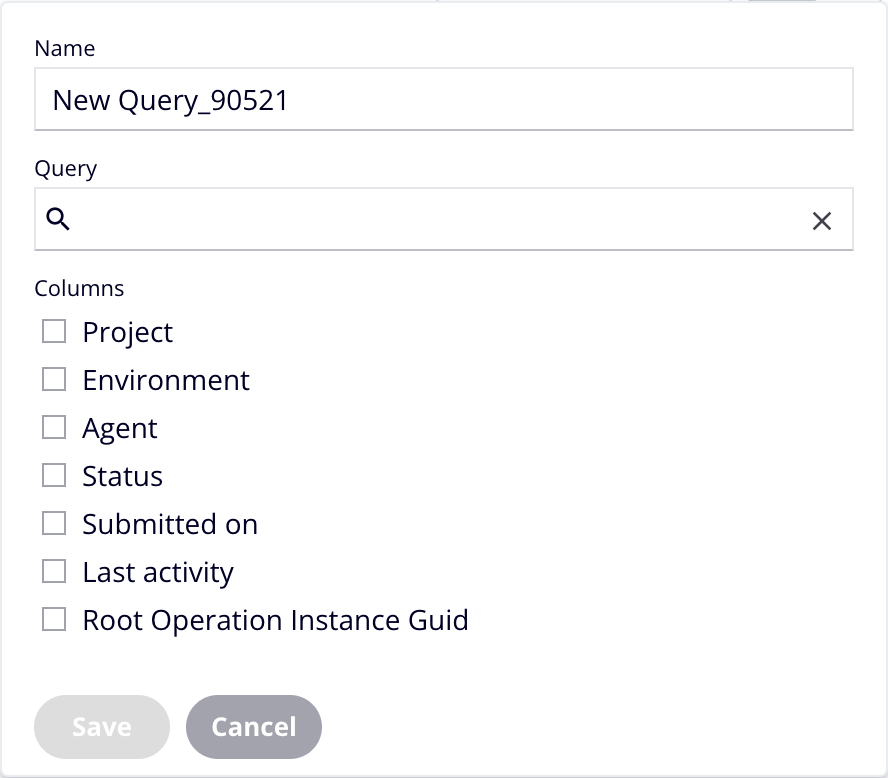
Enter or select values for the following fields, then click Save:
- Name: A name for the query.
- Query: One or more query terms using the same syntax as the search bar. You can add terms in the following ways:
- Click the field to show a list of available search terms. Select one to enter it into the query field, then add an operator and a value.
- Select one of the query suggestions.
- Enter a query term, followed by a semicolon.
-
Columns: Select the columns to display in the search results.
When saved, the Saved queries form opens:
Click Saved queries to close it.
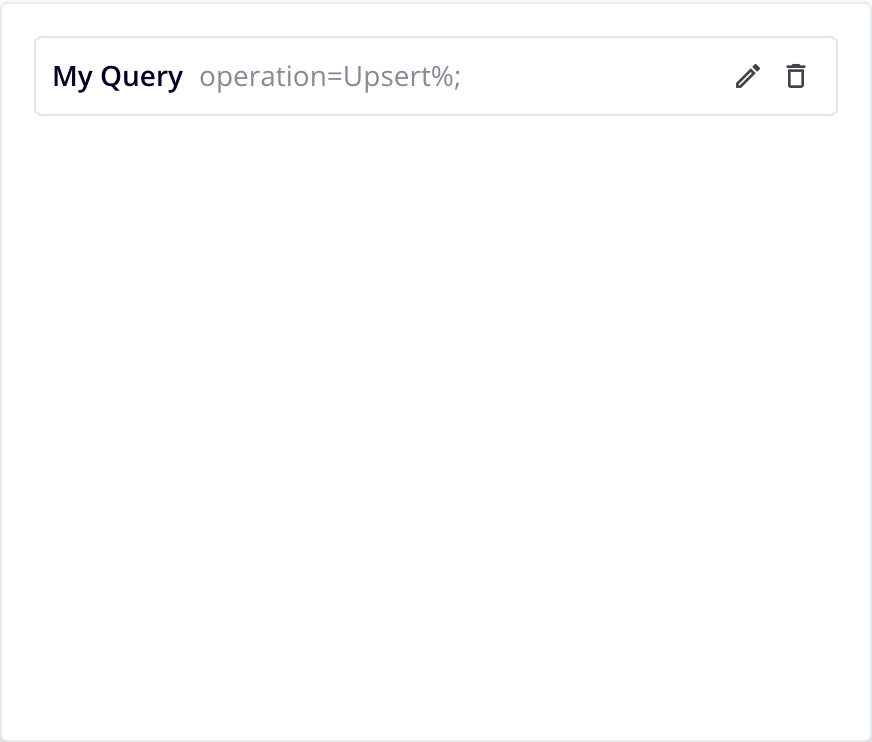
-
To use a saved query, click Saved queries, then click the query you want to run. The query terms are copied to the query bar, and the query runs automatically.
-
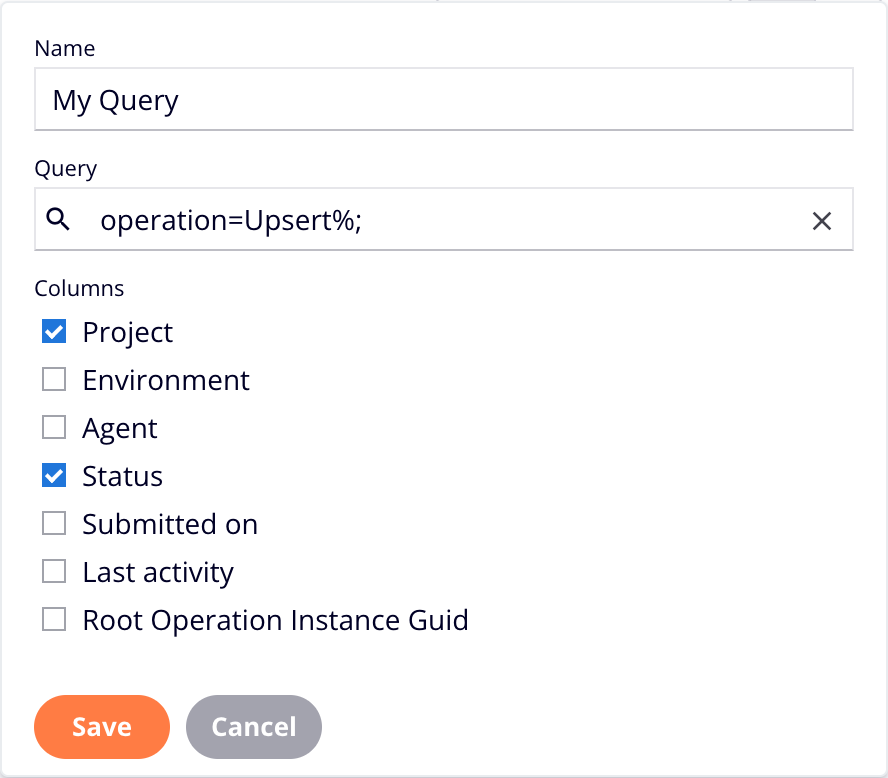
To edit a saved query, click Saved queries, click the Edit icon for query you want to edit. The query opens in the Edit query drawer:
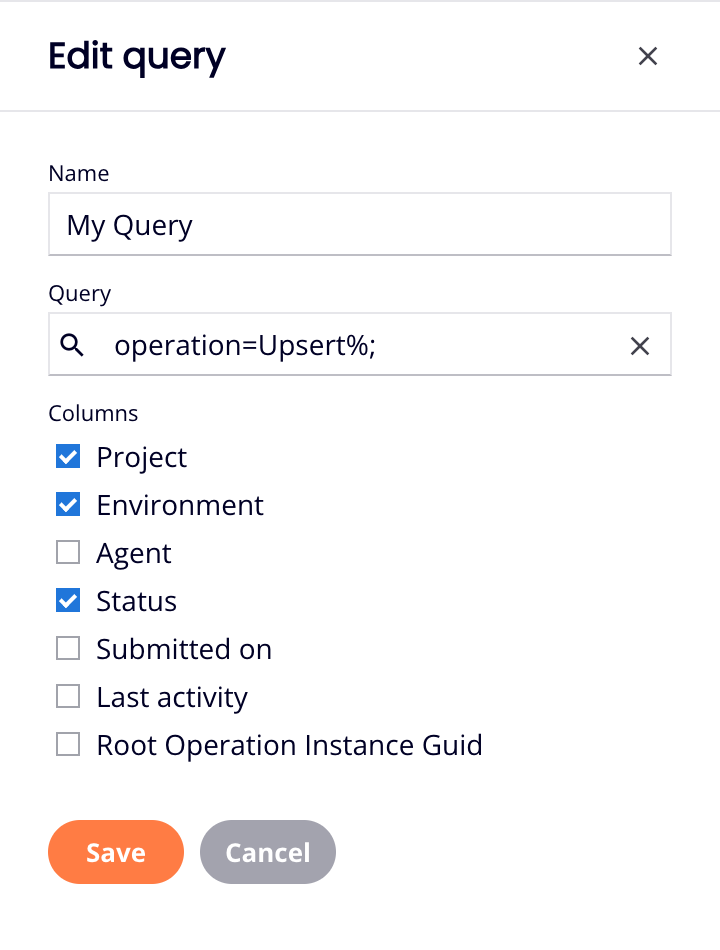
Edit the query, then click Save to save it, or Cancel to cancel.
-
To delete a saved query, click Saved queries, then click the Delete icon for the one you want to delete. A Delete Saved Query dialog asks you to confirm. Click Delete to continue, or Cancel to cancel.
Time range
The Runtime Operations page shows operation logs for the time period shown in the time range menu:
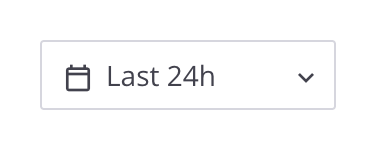
To change the period, open the menu and select one of the following options:
- Last 24 hours
- Last 48 hours
- Last 72 hours
-
Custom time: Select to open the Custom time dialog. With this, you can filter operations based on the dates for the Last Activity and Submitted On fields:
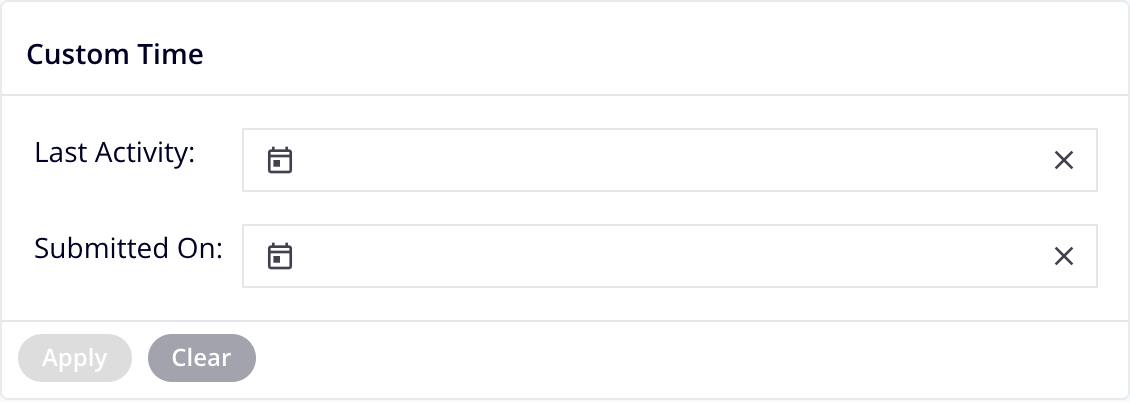
Click a calendar icon to open a date picker for a field:
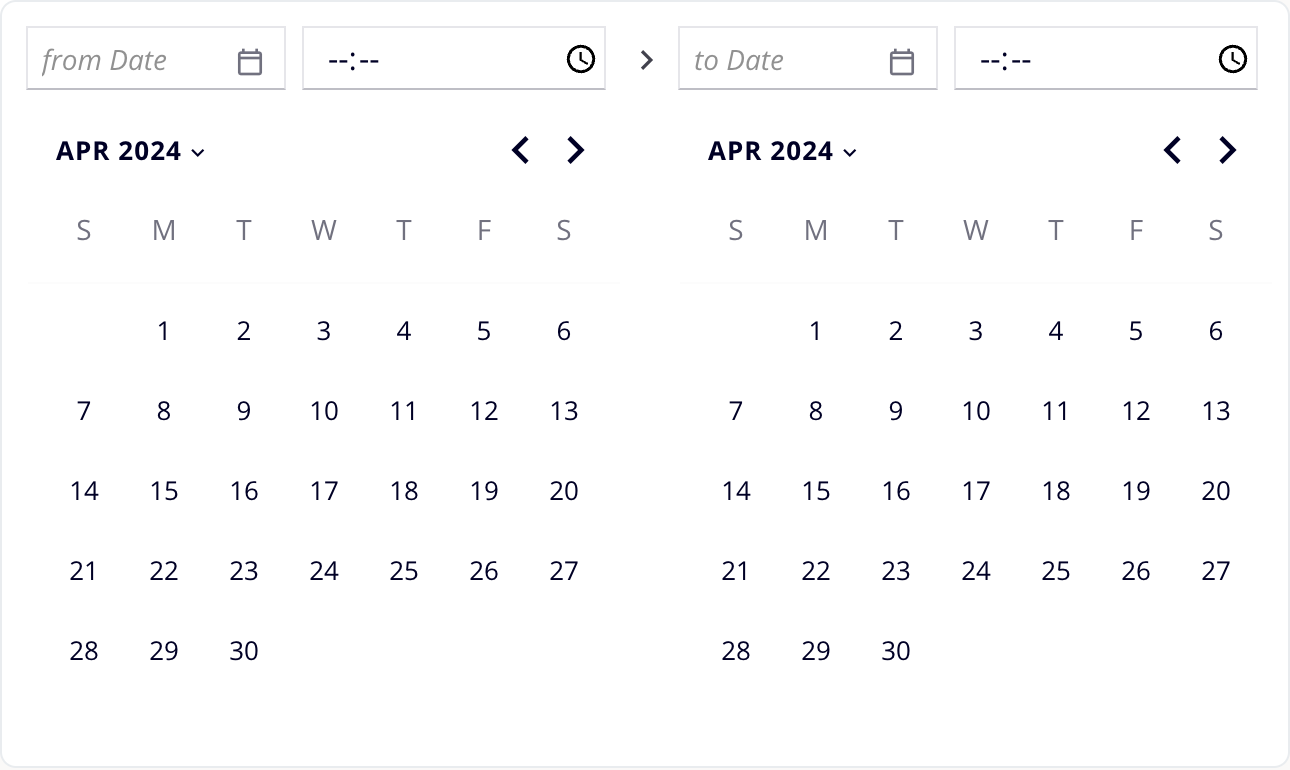
Set either or both of the from or to dates using the calendar.
To set a time, click the
icon and choose the hour and minute, or enter a time in HH:MM format. Click anywhere on the Custom Time dialog to close the date picker.
When either or both field date ranges are set, click Apply. To clear the range, click Clear. To clear a field's dates, click its icon.
Page settings
You can sort the table, rearrange its columns, or refresh its contents:
-
Sort: To sort the table in ascending order, click any column heading. Click again to reverse the sort order.
-
Columns: To change the arrangement and visibility of columns, click Filter Columns. The Columns drawer opens:
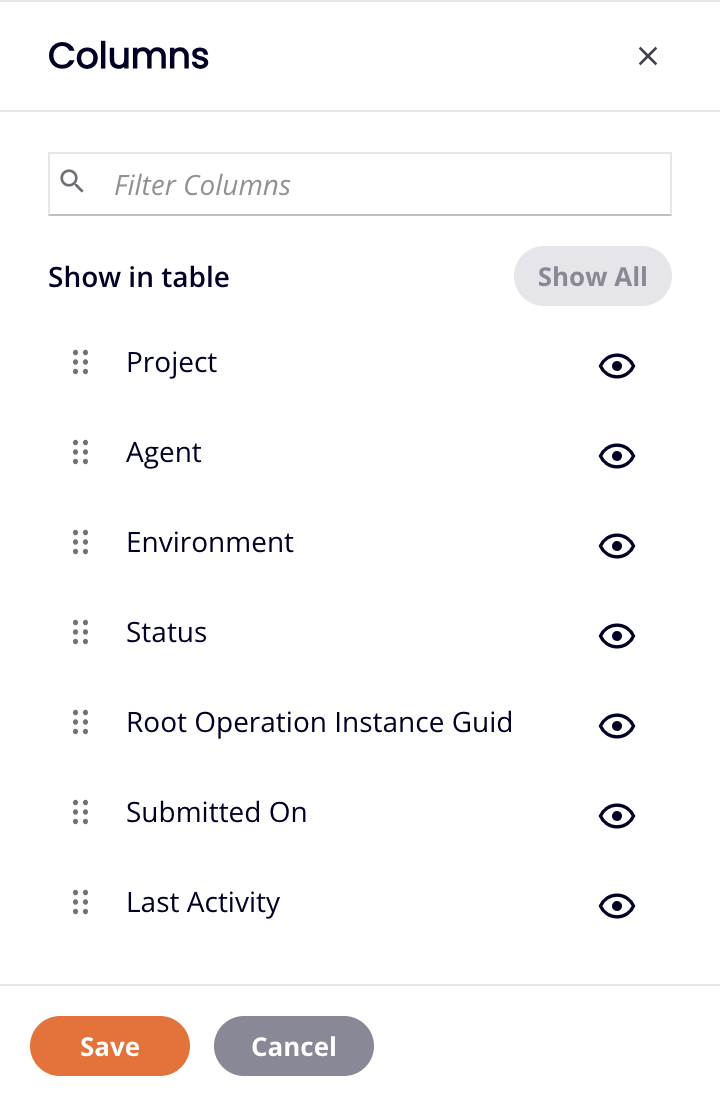
The drawer has the following controls:
- Show All: Make all columns visible.
- Move: Drag and drop to change the position of the column relative to others.
- Hide: The column is visible. Click to hide it.
- Show: The column is hidden. Click to show it.
- Save: Save the columns.
- Cancel: Close the columns drawer without saving changes.
-
Refresh: The table updates automatically. The default interval is 5 minutes.
To change the automatic refresh interval, click Settings. The Settings drawer opens:
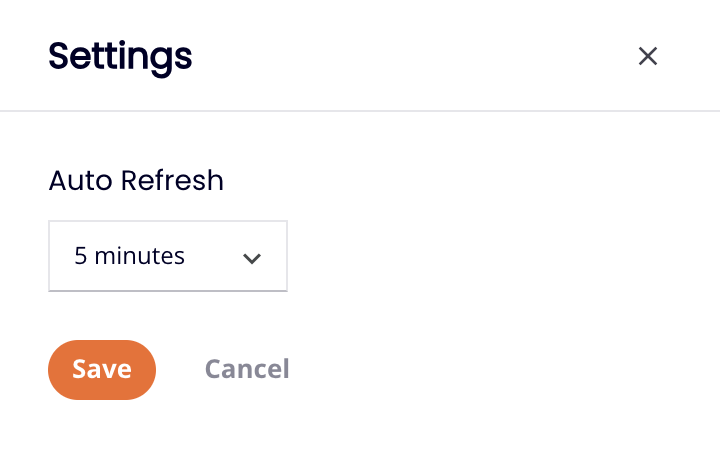
Select an auto refresh interval, one of 1, 5, 15, or 30 minutes, then click Save.
To refresh the table at any time, click Refresh.