Dashboard page in Jitterbit Management Console
Overview
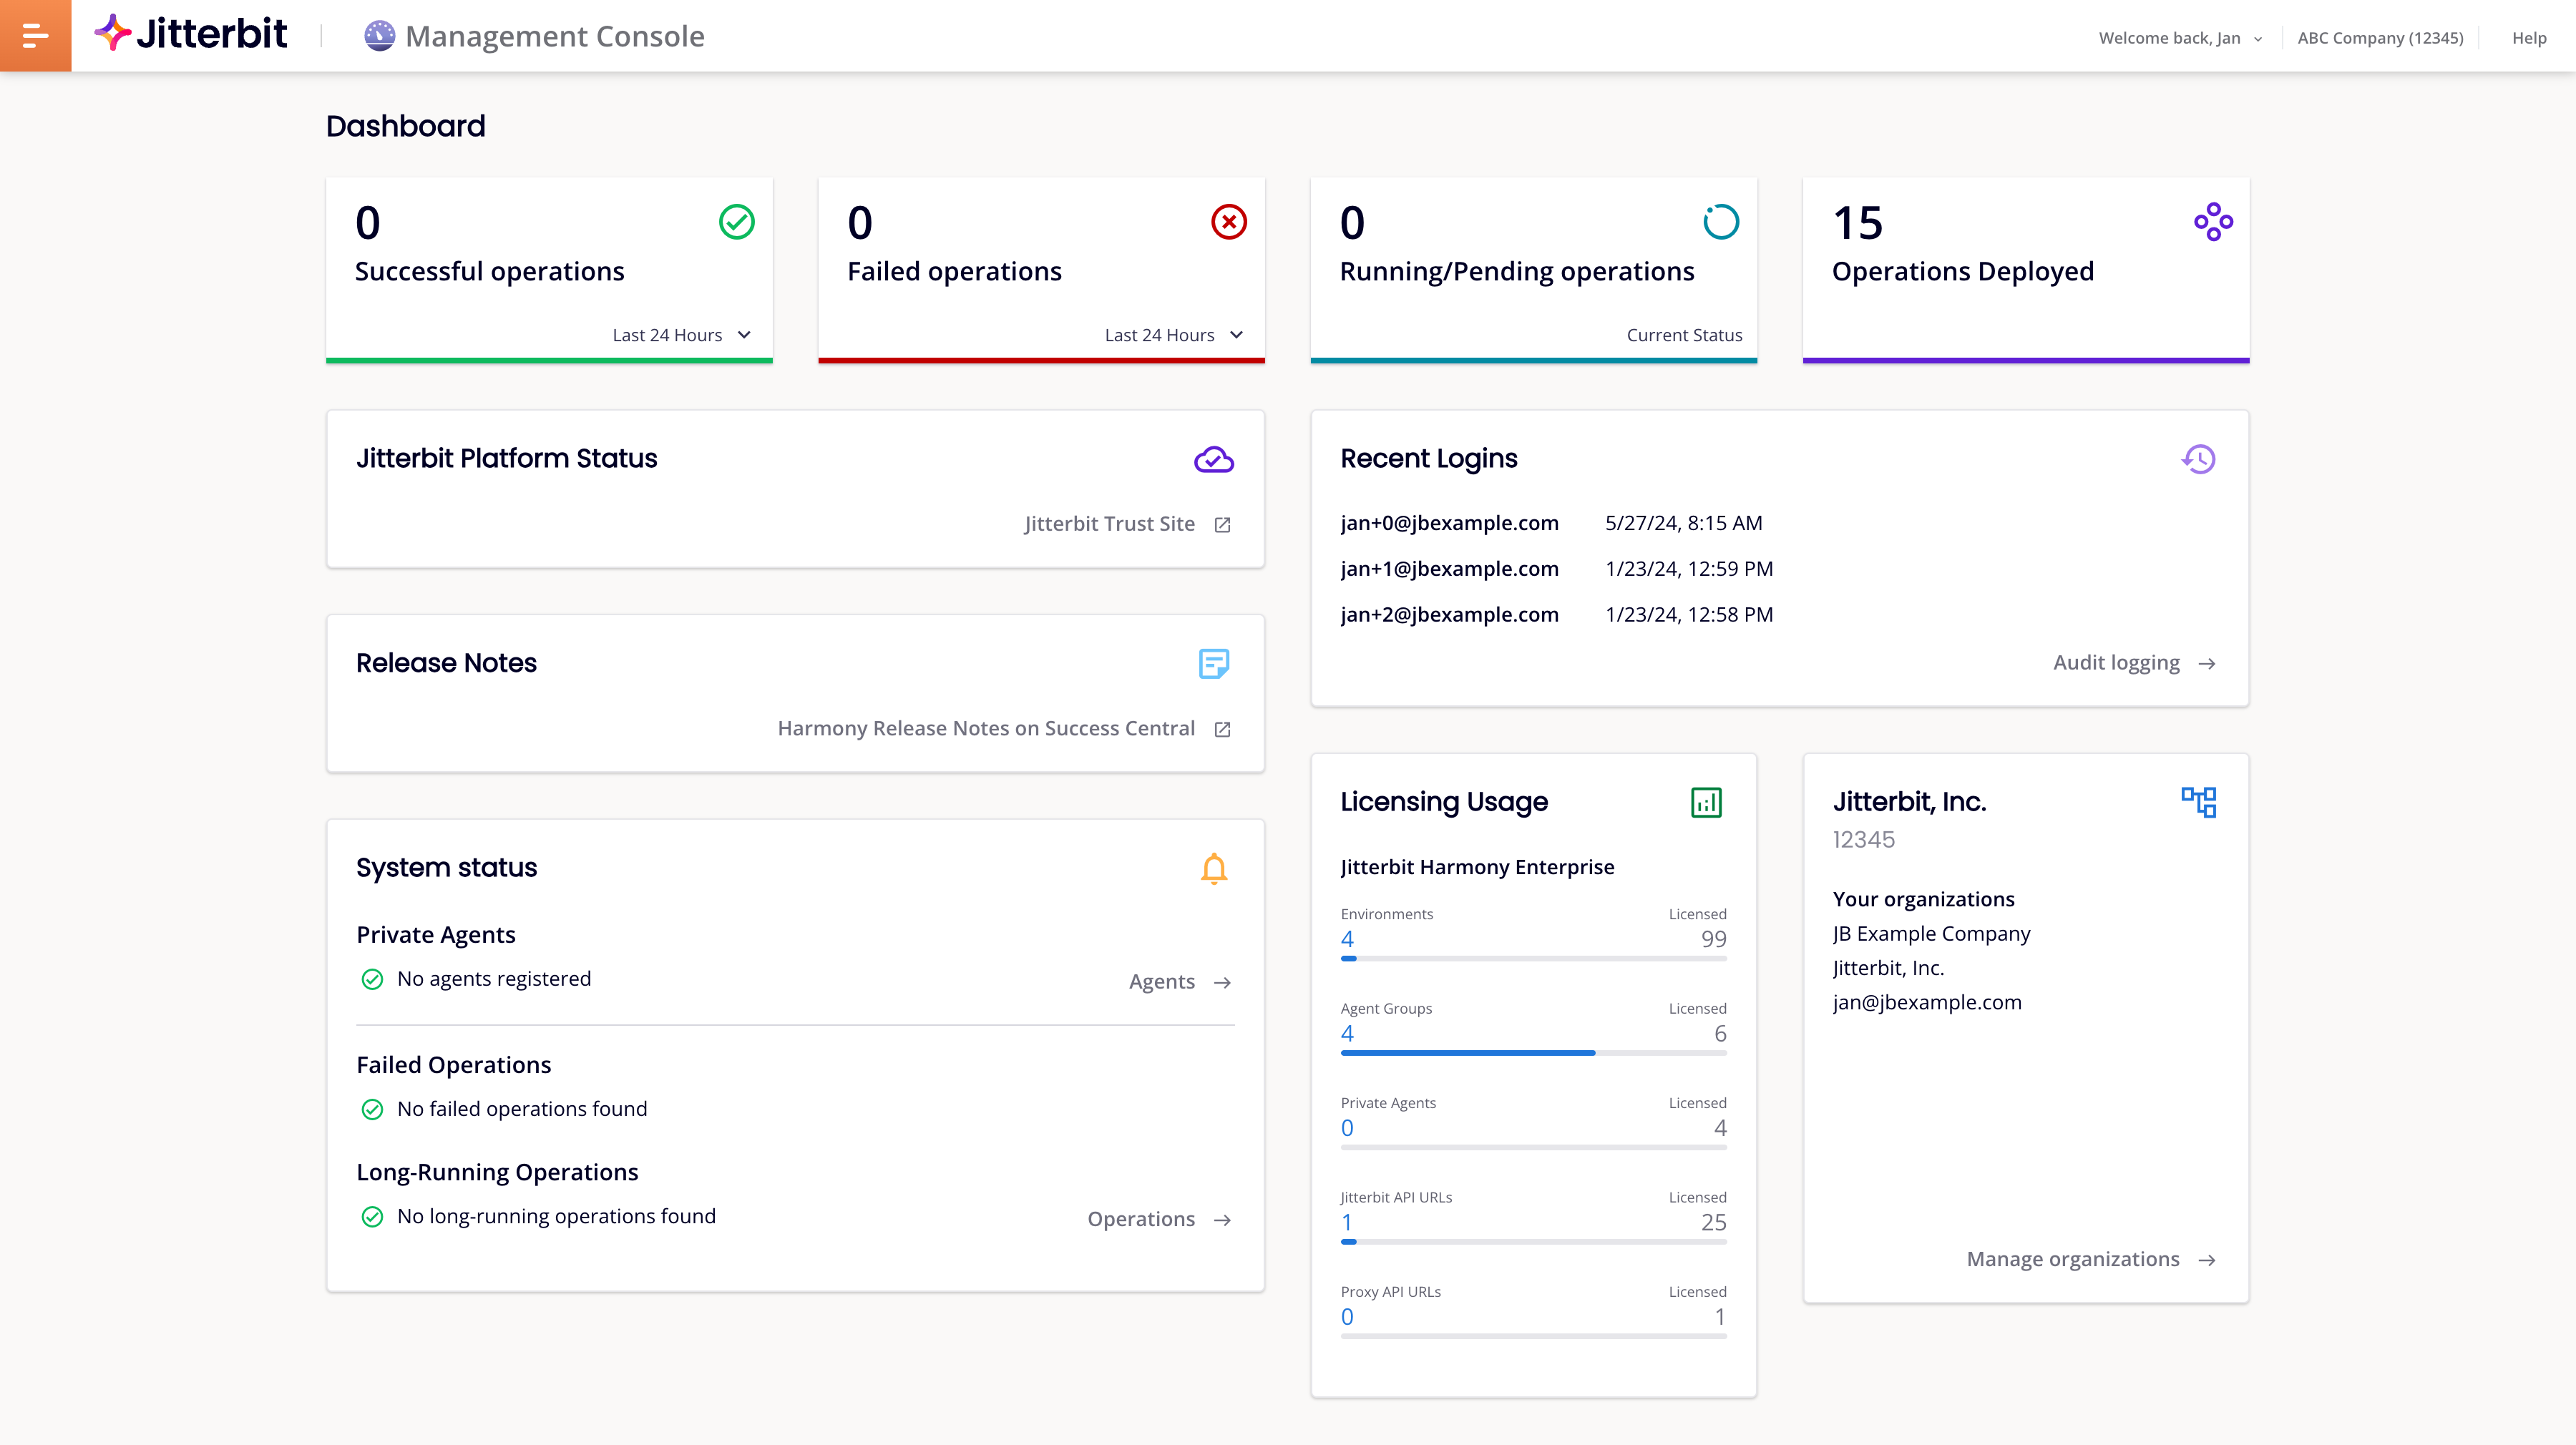
The Dashboard page of the Management Console provides Harmony organization administrators with a central location to manage and monitor the status of your Harmony integration projects.
Members of a role that has been granted the Read organization permission can also access the Dashboard page.
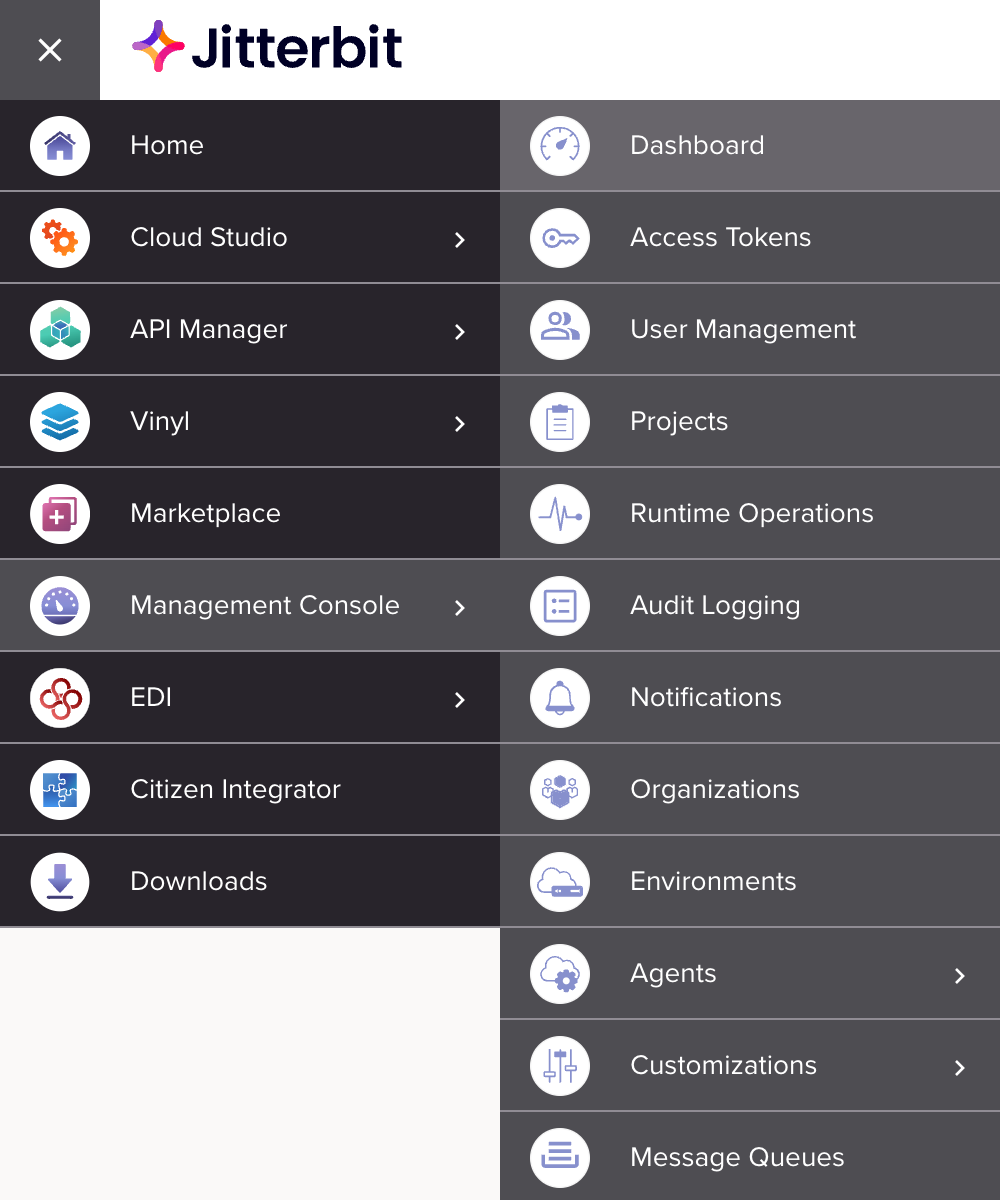
To access the Dashboard page, log in to the Harmony portal, then use the Harmony portal menu in the top left and navigate to Management Console > Dashboard:
Note
Data displayed on the Dashboard page is auto-refreshed every minute.
Dashboard tiles
The Dashboard page displays nine tiles:
-
Successful Operations: Displays the number of operations with a
Success,Success with Info,Success with Warning, orSuccess with Child Errorstatus (maximum 10,000). Click this tile to navigate to the Runtime Operations page, filtered to display all operations with these statuses.- Last 24 Hours: Use the menu to select whether to display the number of successful operations for the Last 24 Hours or Last 48 Hours. Successful operations for the selected period are between 12:00 am to 11:59 pm on your local machine's time zone.
-
Failed Operations: Displays the number of unsuccessful operations with an
Error,Cancelled,Cancel Requested, orSOAP Faultstatus (maximum 10,000). Click this tile to navigate to the Runtime Operations page, filtered to display all operations with these statuses.- Today: Use the menu to select whether to display the number of unsuccessful operations for Today or Yesterday. Unsuccessful operations for the selected day are counted for that calendar day (that is, 12:00 am to 11:59 pm) using your local machine's time zone.
-
Running/Pending Operations: Displays the number of operations with a
Submitted,Pending,Running, orReceivedstatus (maximum 10,000). Click this tile to navigate to the Runtime Operations page, filtered to display operations with these statuses. -
Operations Deployed: Displays the number of currently deployed operations (maximum 10,000). Click this tile to navigate to the Runtime Operations page.
Note
For operations that have been deployed more than once, the number displayed in the tile does not include any subsequent deploys for an operation.
-
System Status: Displays the status of any private agents, failed operations, and long-running operations. Click Agents to navigate to the Management Console Agents page or Operations to navigate to the Runtime Operations page.
Note
Long-running operations are operations that have been running for 20 minutes or longer. Only two long-running operations for an organization are displayed on this tile.
-
Recent Logins: Displays the five most recent users to log in to the selected organization. Login information is shown only for users that have the selected organization set as their default organization. The date and time of the login is displayed next to the username. Click Audit Logging to navigate to the Audit Logging page.
-
Licensing Usage: Displays the current Harmony organization's subscription type as well as the current usage of available environments, agent groups, private agents, and published API Manager APIs. For information on increasing limits, contact your Customer Success Manager (CSM).
-
Selected Organization: Displays this information:
-
The name of the currently selected organization.
-
The Harmony organization ID for the currently selected organization.
-
A list of any other organizations of which you are a member.
Click Manage Organizations to navigate to the Organizations page.
-
-
Jitterbit Platform Status: Click Jitterbit Trust Site to navigate to the Jitterbit Trust Site, which provides information on Harmony availability and security statuses.
-
Release Notes: Click to navigate to the Harmony release notes page.
Rearrange tiles
The positions of the top four tiles are fixed, but you can change the relative positions of the remaining tiles.
To do this, hover on a tile to reveal the Move handle, then drag and drop to move the tile.