Tracing
Overview
New in Vinyl 3.1 Tracing is a diagnostic feature available within Vinyl that allows Developer Users to troubleshoot applications. Tracing can be an instrumental tool for debugging performance related issues in an app, as well as using it to troubleshoot things that aren't working as expected in an app. For Users who have permission to use the Tracing feature, it is able to be accessed from several different locations in Vinyl, as described in this article.
Ideally Trace is a feature that is used on a Development environment, but it is available to use in Production if necessary. For performance reasons, try and restrict running Trace in Production unless absolutely needed. If enabled, the Trace feature will automatically disable itself after an hour of inactivity for a User that it has been enabled for. This is by design.
By default all Trace records get stored in the Vinyl database in the Dg_Trace table. Every hour a scheduled task runs to delete and purge records from this table.
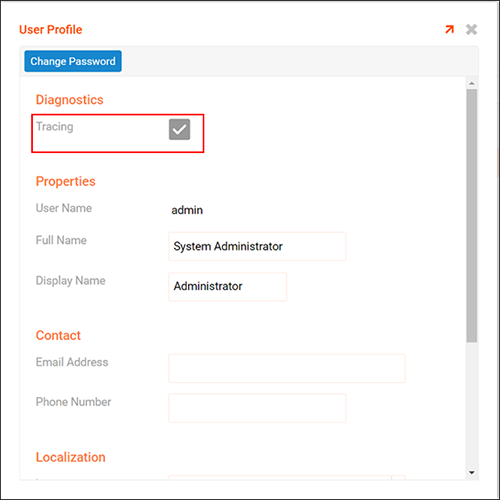
To Enable Tracing from User Profile
Tracing is stored at the User Profile level, so if you are a Developer User you'll see a Tracing option on your User Profile page. If the Tracing field is checked then the Trace feature has been enabled or turned on for the associated User.
To Enable Tracing from Security
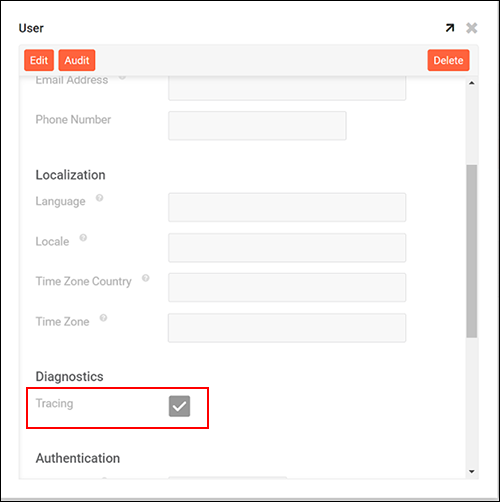
Tracing can also be enabled or turned on from the Security > Users. A Developer User can navigate to the Security area of Vinyl, to the Users screen and open an individual User record from this area in order to access the Tracing option. If the Tracing field is checked then the Trace feature has been enabled or turned on for the associated User.
To Enable Tracing from the Page Designer
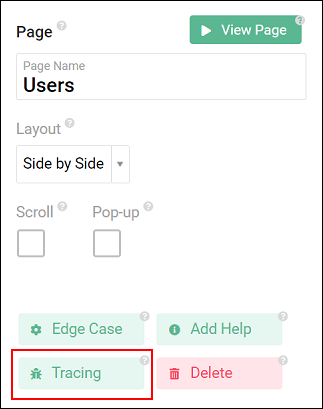
Assuming you have the right Design permissions you can also drill into Tracing for a page from the page design screen.
To Enable and Access Tracing from Monitor
Tracing can also be accessed both to enable it and also to view and interpret the results from the Monitor screen in Vinyl. To access here you navigate to Monitor > Peformance. Once here, you will select the User to run the Trace information for and also set the Status to On. With the feature On you have the User then perform the activity you are looking to trace. For example, navigate to the Page(s) in question.
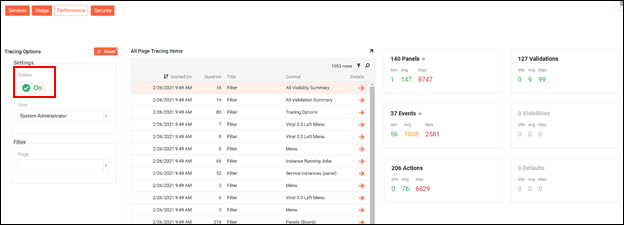
The Trace utility captures resultant metrics displayed as the min, average and max time for per type of metric being stored. You can click on the metrics and drill down to see which one is the slowest.
- Under 1 second is green
- 1 to 2 seconds is yellow
- Over 2 seconds is red
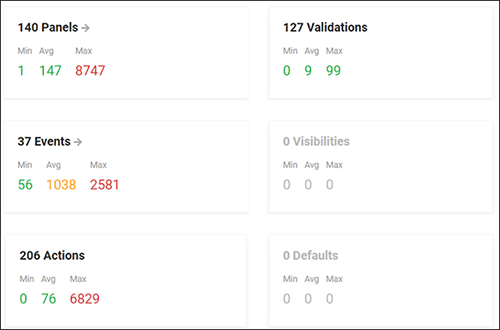
Drill into Panels for example, shows that the Business Rule Builder page is the slowest because of the following Panels/Rules.
To Reset Trace
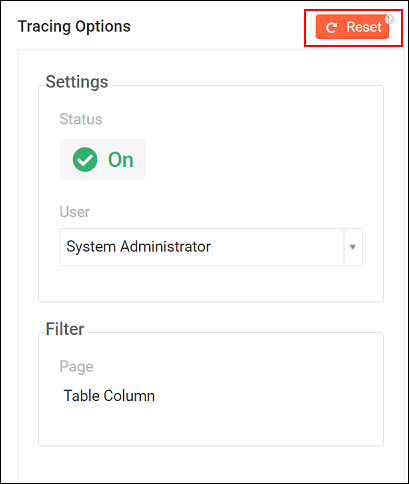
Reset will delete the tracing info for the current filter panel, allowing you to remove info you don't care about, and then perform new actions and see the results.
The status of On or Off is for the User selected, in this case System Administrator.
Maintenance
Tracing is removed after an hour of being available, since a lot of info is stored in the Dg_Trace table.
After one hour of web inactivity by a User, tracing will be turned off for that User.
Example Use Case
An example use case where you might use Trace to gain insight on Vinyl is tracing a value being changed when adding a column to a table.
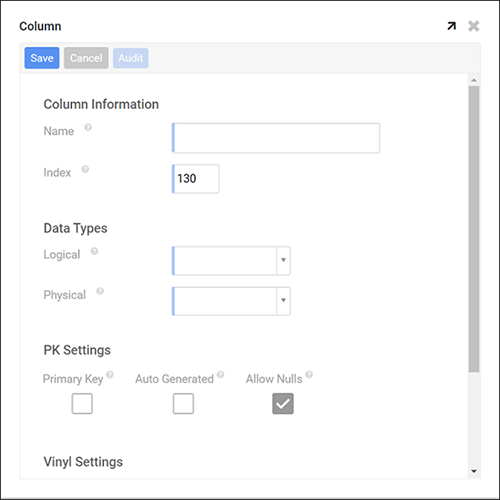
If we add a new Column to a Table, and simply select a Logical Data Type of Currency, this is what the screen looks like in Vinyl:
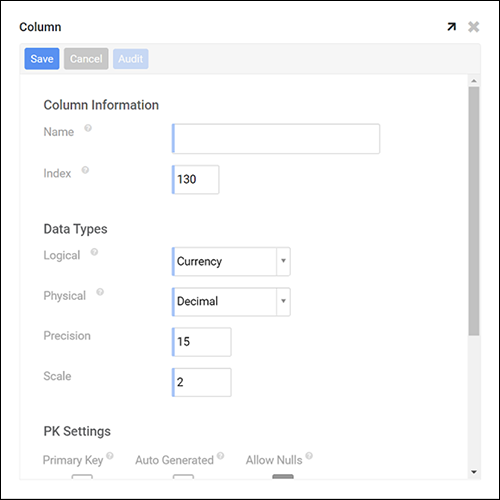
Let's go see what Vinyl logged in Trace:

The first event was loading the data for the select list of for the Logical data type column. You can drill down and get more details by clicking on the orange arrow.

Tells you there were actions executed, lets drill down more.

The filter plugin ran which is what does the actual loading of data from the database.
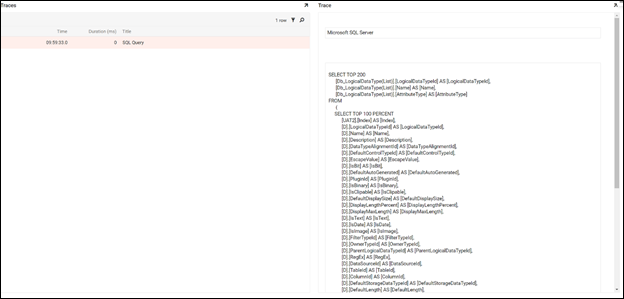
You can now see the SQL statement that was executed to return data for the Select list.

Lets jump back to the top and see the Cell Change, this is what is execute the user selected the Currency data type from the select list.

You can see defaults and visibilities were also run, and because the row is orange it tells us that the current rows state has changed.

By selecting the Defaults row, it shows what defaults got changed. Because we selected Current those values got defaulted in. Let's drill down more to see which default rules caused these to change.
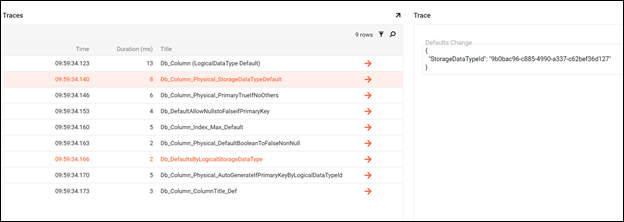
You can see 9 default rows were executed, while 2 of them actually resulted in changing the current rows state. Db_Column_Physical_StorageDataTypeDefault changed the StorageDataTypeId and then later on the Db_DefaultsByLogicalStorageDataType change the Precision and Scale. Let's drill down and see the SQL which caused this.
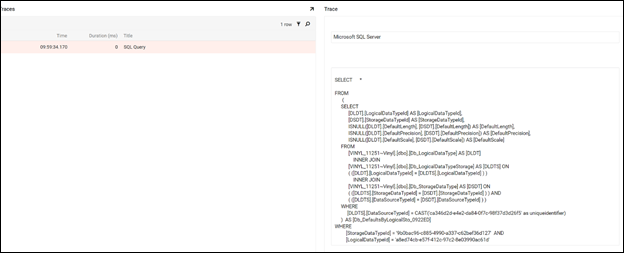
Here you can see the where clause is used, and that value was actually defaulted in early.