Bubble Chart
A Bubble Chart is a variation of a Scatter Chart in which the data points are replaced with bubbles, and an additional dimension of the data is represented in the size of the bubbles.
In order to create a Bubble Chart you'll need an underlying business object that contains an X axis value, a Y axis value and also a Bubble Size value. Bubble Size is indicated in the Chart by selecting the Z Sub Type value.
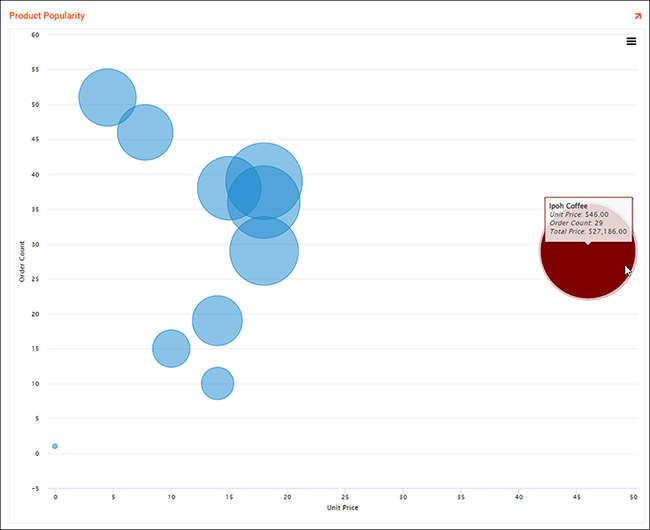
Example Bubble Chart illustrating Product Popularity for Beverages
How to Configure
In this example we'll step through how to configure a Bubble Chart that illustrates Product Popularity for Beverages.
- Create a Dynamic Page to contain the Bubble Chart
- Add a panel to the oage, select Chart as the Panel Type
- Select Bubble as the Chart Type
- Click Next
- Select the Chart Rule created for the Bubble Chart
- Click Next, review and click Finish
- Confirm the Chart Type is set to Bubble
-
Confirm the Controls required are configured for the Bubble Chart:
- Add in the X axis value column. Select Value as the Control Type. Select X as the Sub type. For example: Unit Price
- Add in the Y axis value column. Select Value as the Control Type. Select Y as the Sub type. For example: Order Count
- Add in the Bubble Size column. Select Value as the Control Type. Select Z as the Sub type. For example: Total Price
- Add in any of the optional Controls:
- The Sub Type Title allows you display text on hover over a bubble on the resultant chart. For example: Product Name
-
The Color Control Type allows you to specify conditional formatting for colors that meet specific criteria. For example you might configure the following logic in the business object to define any bubble that is greater than 21.9 will be displayed as maroon:
IIF(P.UnitPrice>21.9, 'maroon', null)
-
Save and run the Chart page to confirm the results