Chart Types
Line
A Line Chart displays information as a series of data points called 'markers' connected by straight line segments. It is a basic type of Chart common in many fields. It is like a Scatter Plot except that the measurement points are ordered (typically by their x-axis value) and joined with straight line segments. A Line Chart is often used to visualize a trend in data over intervals of time – a time series – thus the line is often drawn chronologically. In these cases, they are known as run charts.

Area
An Area chart displays graphically quantitative data. It is based on the Line Chart. The area between axis and line are commonly emphasized with colors, textures and hatchings. Commonly one compares two or more quantities with an Area chart.
Area Charts are used to represent cumulated totals using numbers over time. Use the Area Chart for showing trends over time among related attributes.
When multiple attributes are included, the first attribute is plotted as a line with color fill followed by the second attribute, and so on.

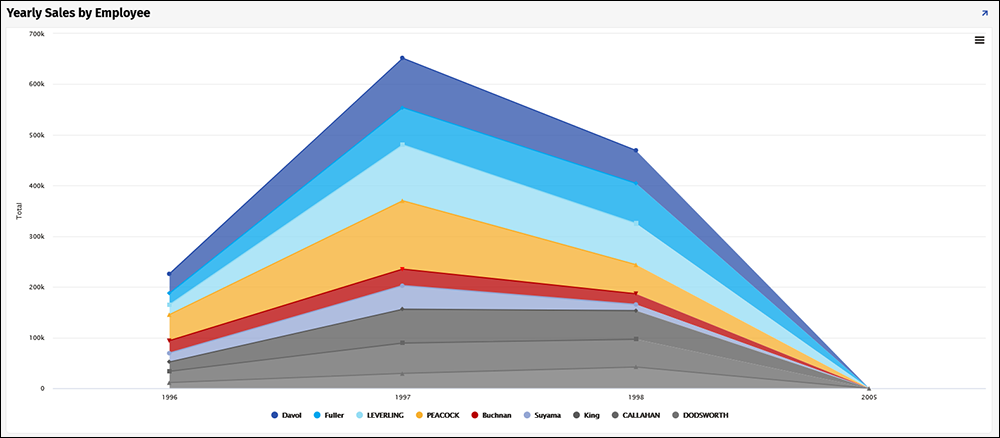
Stacked Area
A Stacked Area chart is an extension of a basic Area chart. Sometimes referred to as a Mountain chart, a Stacked Area chart adds together the data series values to make up a total. Use this chart type when you want to track total value as well as understand the breakdown of total by groups.
Percentage Area
A Percentage Area Chart is similar to an Area Chart, except the values are displayed as a percentage that adds up to 100.

Spline
Area Charts in which data points are connected by smooth curves instead of straight lines are called Spline Charts.

Bar
A Bar Chart presents categorical data with rectangular bars with lengths proportional to the values that they represent. A Bar Chart shows comparisons among discrete categories. One axis of the Chart shows the specific categories being compared, and the other axis represents a measured value. Some Bar Charts present bars clustered in groups of more than one, showing the values of more than one measured variable.

3D Bar
A 3D Bar Chart will draw each column as a cuboid and thus create a 3D effect.

Stacked Bar
The Stacked Bar Chart stacks bars that represent different groups on top of each other. The length of the resulting bar shows the combined result of the groups. However, Stacked Bar Charts are not suited to datasets where some groups have negative values. In such cases, Grouped Bar Charts are preferable.

Column
Column Charts are similar to Bar Charts, except the bars display vertically instead of horizontally.

3D Column
A 3D Column Chart will draw each column as a cuboid and thus create a 3D effect.

Stacked Column
A Stacked Column Chart is similar to a Stacked Bar Chart, except the data is displayed vertically instead of horizontally.

Funnel
Funnel Charts are often used to represent stages in a sales process, and show the amount of potential revenue for each stage. This type of Chart can also be useful in identifying potential problem areas in an organization's sales processes. A Funnel Chart is similar to a Stacked Bar Chart.
A Funnel Chart displays values as progressively decreasing proportions amounting to 100 percent in total. The size of the area is determined by the series value as a percentage of the total of all values. Any Funnel consists of the higher part called head (or base) and the lower part referred to as neck.
Ideally the Funnel Chart shows a process that starts at 100% and ends with a lower percentage where it is noticeable in what stages the fall out happens and at what rate. If the Chart is also combined with research data, meaning quantified measurements of just how many items are lost at each step of the sales or order fulfillment process, then the Funnel Chart illustrates where the biggest bottlenecks are in the process.

Pyramid
A Pyramid Chart is a kind of Funnel chart that presents data in the similar way the Funnel does. The main different of the Pyramid Chart from the Funnel is an absence of the neck part.

Pie
A Pie Chart is divided into slices to illustrate numerical proportion. In a Pie Chart, the arc length of each slice (and consequently its central angle and area), is proportional to the quantity it represents.

3D Pie
A 3D Pie Chart is a Pie chart that is displayed at an angle to give it the illusion of depth.

3D Donut
A 3D Donut Chart is a variant of the Pie Chart, with a blank center allowing for additional information about the data as a whole to be included. 3D Donut Charts provide a better data intensity ratio than standard pie charts. 3D Donut Charts do not have to contain information in the center.

Semi-Circle Donut

Mixed
Using Secondary Axis you can present a Chart with two vertical axis showing different sets of data, in this example Sales and Historical Sales. This uses the "Mixed" Chart Type to create a bar and line Rolling Total Chart.

Bubble
A Bubble Chart is a variation of a Scatter Chart in which the data points are replaced with bubbles, and an additional dimension of the data is represented in the size of the bubbles.

Marimekko
A Marimekko is a two dimensional stacked chart. In addition to the varying segment heights of a standard stacked chart, a Marimekko chart also has varying column widths. Column widths are scaled so that the total width matches the desired chart width. Marimekko Charts are often used to analyze market and sales data.

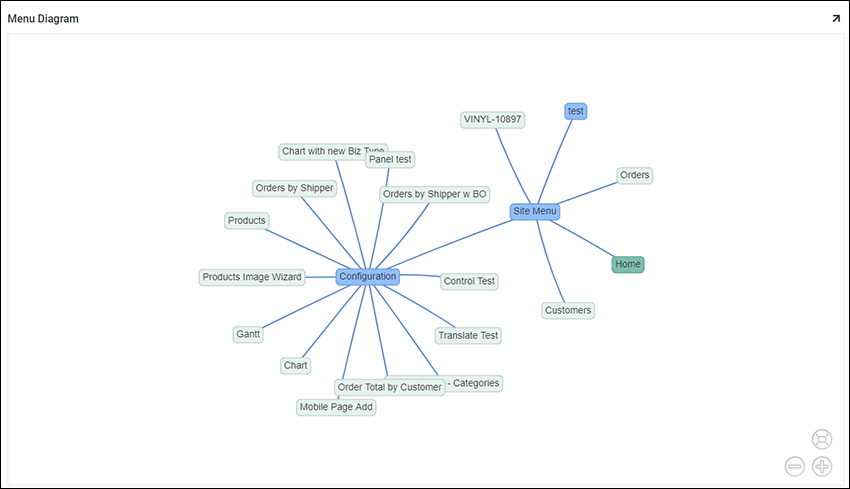
Network
Network Graphs are available in Vinyl and have many different business use cases, including showing relationships between companies, people, or products. A Network Graph helps visualize how things are interconnected with each other, where entities are displayed as nodes and relationships between them are displayed with lines.
A User can interact with the Network Graph using the tools in the lower right corner and also by dragging within the panel itself. The Network Graph can be saved outside of Vinyl by right mouse clicking on top of the diagram, and choosing Save Image as.... This will place an image file to the location you direct.
More Information About Charts
How to Create a Basic Bar Chart How to Create a Rolling Total / Mixed Chart Type How to Create a Secondary Axis Chart How to Create a Bubble Chart How to Create a Marimekko Chart How to Create a Network Graph More Information on the Chart Library that Vinyl Uses