Gantt Charts
Vinyl has a Gantt panel option that supports displaying a Gantt chart. Gantt charts are useful for planning and scheduling projects. They help you assess how long a project should take, determine the resources needed, and plan the order in which you'll complete tasks. They're also helpful for managing the dependencies between tasks.
Gantt Charts allow a User to zoom in on the chart itself, in order to view a certain region of information zoomed in on from the chart. In order to zoom, left click and drag the mouse control over the region you want to enlarge. After zooming, you can reset the chart by clicking on the Reset Zoom button in the top right region of the chart.
In order to create a Gantt chart on a Gantt panel, you'll need a Business Object that contains information for the controls the chart requires. Task and Start Date are required controls, End Date and Color are optional values that can also be stored. Gantt charts can also be used to represent and display task dependencies and task groups (assuming information about these values is configured in the Business Object). See the Gantt chart Controls section of this article for an overview of Controls the Gantt chart works with.
Note
See the Underlying Data Example section of this article to review a CSV file illustrating how the supporting data looks for a Gantt chart.
Gantt Chart Controls
| Name | Required | Description |
|---|---|---|
| Task | Yes | Represents each row of data from the Business Object as an individual block of time with duration defined by Start and End values |
| Start | Yes | Start Date/Time of each individual Task |
| End | No | End Date/Time of each individual Task. If End is not populated or equal to Start, the Task will be visually represented on the Gantt Chart by a single point, known as a Milestone |
| Color | No | The color of the Task or Milestone block. Example: #008000 |
| Dependency | No | Determines relationship from the Task to the other Tasks it is dependent on. This defines for each Task "Which tasks am I dependent on?" and not "Which tasks are dependent on me?". |
| ParentTask | No | For hierarchical arrangement of Tasks, is a reference to another Task from the Business Object. Tasks with same ParentTask are placed as siblings on the hierarchy. Supports multi-level hierarchies and expanding/collapsing for navigation. |
| TaskGroup | No | Used for grouping or placing mutliple Tasks on the same row. Tasks with same TaskGroup display on the same row of the Gantt Chart. |
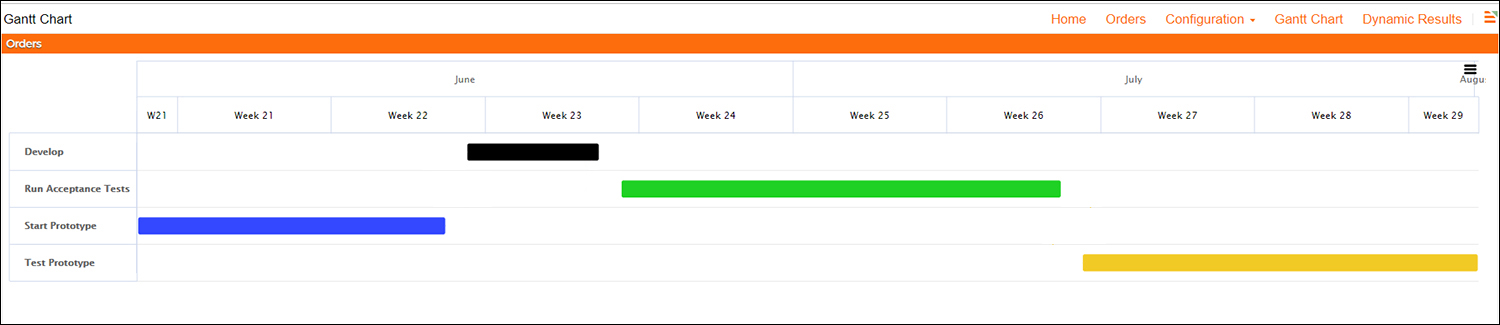
Managing Task Dependencies
Gantt Charts can also display Task Dependency information, where you first define Task Dependency information in the Business Object used for the Chart, and then add Dependency as a Control type to the chart.
| Task | Dependency |
|---|---|
| Start Prototype | |
| Develop | Start Prototype |
| Run Acceptance Test | Develop |
| Test Prototype | Run Acceptance Test |

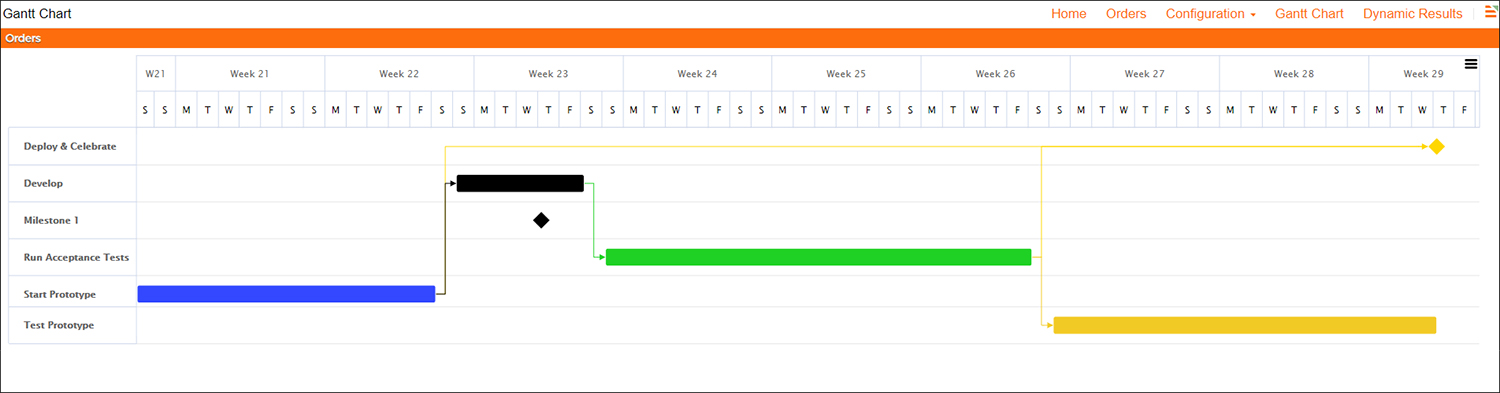
Multiple Dependencies
Gantt Charts can display multiple Dependencies for Tasks. To do so, the underlying Business Object must be configured to have information to represent the multiple dependencies.
Multiple Dependency Example Data
| Task | Dependency |
|---|---|
| Start Prototype | |
| Develop | Start Prototype |
| Run Acceptance Test | Develop |
| Test Prototype | Run Acceptance Test |
| Deploy & Celebrate | Start Prototype |
| Deploy & Celebrate | Run Acceptance Test |
| Deploy & Celebrate | Test Prototype |
Gantt Panel Sub Types – Stacked vs. Side by Side
To support advanced grouping and hierarchies in Gantt Charts, the following two Sub Types are available:
Stacked (Default):
- Common use case: Project Management
- Each Task from the Business Object will be on its own row on the resultant Gantt Chart (1-1)
- Visualizes work breakdown structure for projects
- Has Tasks on the vertical axis with duration of the tasks on the horizontal axis
- Displays time intervals of the Tasks and their Dependencies
Side by Side:
- Common use case: Resource Management and Scheduling
- Multiple Tasks from the Business Object can get grouped into one row on the resultant Gantt Chart (N-1)
- Places Tasks on horizontal tracks, using the vertical axis as the group
- Displays time intervals of the Tasks and their dependencies
Note
The Controls described in Gantt Chart Controls are the same for both Sub Types. If only using these Controls, both Sub Types will output the same chart. Differences between the two Sub Types are documented below.
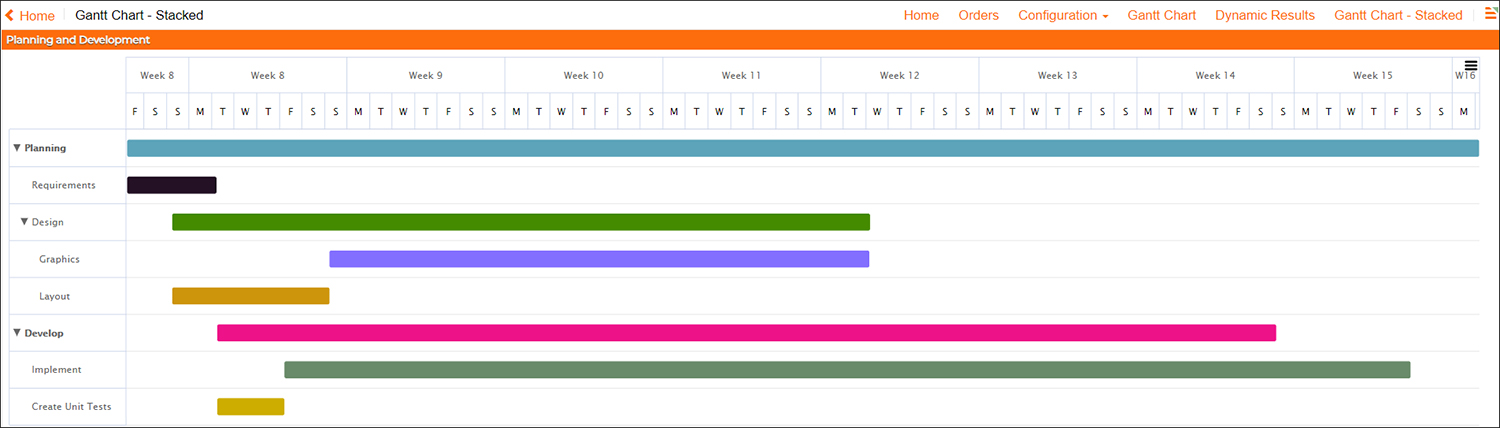
Stacked Sub Type
ParentTask (Control)
- For hierarchical arrangement of Tasks
- ParentTask requires an individual row or record representing it in the Business Object
- Tasks with the same ParentTask will be placed as siblings in the hierarchy
- Supports multi-level hierarchies and expanding/collapsing for navigation
Note
When defining a ParentTask in its own row of data from the Business Object, Start and End are both optional. If left blank, the Task will inherit the earliest start and latest end of its children Tasks.
ParentTask Example Data
| Task | Parent Task |
|---|---|
| Planning | |
| Requirements | Planning |
| Design | Planning |
| Layout | Design |
| Graphics | Design |
| Develop | |
| Create Unit Tests | Develop |
| Implement | Develop |
Combining ParentTasks and Dependencies
| Task | Parent Task | Dependency |
|---|---|---|
| Project 1 | ||
| Task A | Project 1 | |
| Task B | Project 1 | Task A |
| Project 2 | ||
| Task C | Project 2 | |
| Task D | Project 2 | Task B |
| Task D | Project 2 | Task C |
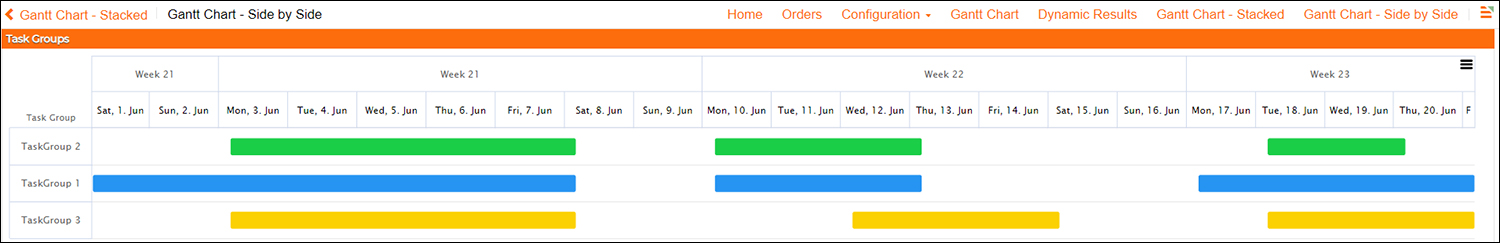
Side by Side Sub Type
TaskGroup (Control)
- Used for grouping or placing multiple Tasks onto the same row
- Tasks with the same TaskGroup will show up on the same row of the Gantt Chart
TaskGroup Example Data
| Task | Task Group |
|---|---|
| Task 1 | TaskGroup 1 |
| Task 2 | TaskGroup 1 |
| Task 3 | TaskGroup 1 |
| Task 4 | TaskGroup 2 |
| Task 5 | TaskGroup 2 |
| Task 6 | TaskGroup 2 |
| Task 7 | TaskGroup 3 |
| Task 8 | TaskGroup 3 |
| Task 9 | TaskGroup 3 |
Combining TaskGroups and Dependencies
Combining Example Data
| Task | Task Group | Dependency |
|---|---|---|
| Task 1 | TaskGroup 1 | |
| Task 2 | Task 1 | |
| Task 3 | TaskGroup 1 | Task 2 |
| Task 4 | TaskGroup 2 | |
| Task 5 | TaskGroup 2 | Task 1 |
| Task 6 | TaskGroup 2 | Task 2 |
| Task 7 | TaskGroup 2 | Task 6 |
How to Configure a Gantt Chart in Vinyl
This assumes you already have a Business Object which contains all the Controls you'll need to work with for the Gantt Chart. See the article information for a full description on the types of Controls and Sub Types the Gantt Chart supports.
- Create a Dynamic Page to contain the Gantt chart
- Add a Panel to the page, select Gantt as the Type
- For the Source select the Business Object created for the Gantt Chart
-
Add in the Controls required for the type of Gantt Chart being created:
- Task is required
- Start is required
- End is optional
- Color is optional
- Dependency is optional
- ParentTask is optional
- TaskGroup is optional
-
Set the Sub Type value if required for the type of Gantt Chart being created:
- Stacked
- Side by Side
-
Run the Page and test the Gantt Chart
Underlying Data Example
In order to use Gantt Charts, you have to get the underlying data defined properly. To help illustrate this concept, please review the linked Task table data example which is used to generate the Multiple Dependencies Gantt Chart shown in this article.