How to Create a Gradient Fill for a Chart
This article will walk you through how to create and use a gradient fill for a Chart using a JSON Template. The example shown uses an Area Chart. This article assumes you have a Chart with its underlying data already created, and you are going to create a JSON Template to use to achieve a gradient fill.
Note
This example illustrates changing Data Labels appearing on the Chart to use a specified font size and type. You can remove the "area" part of the JSON syntax if you don't want to modify the Data Label information.
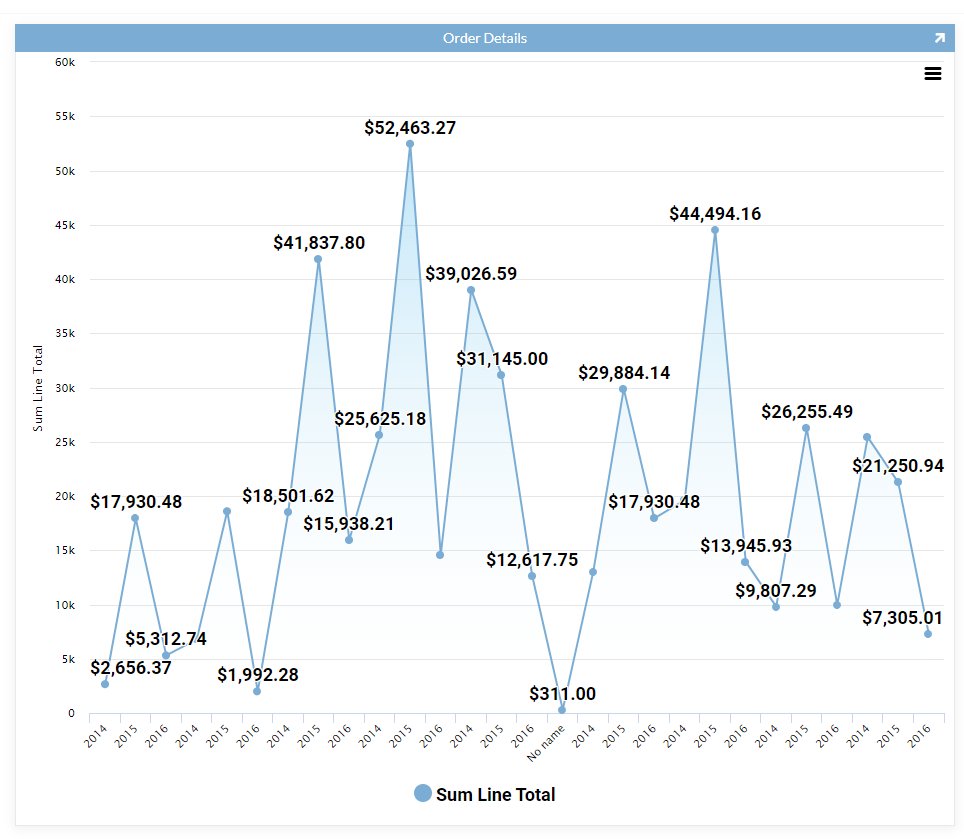
Example of gradient fill applied to an Area Chart
Step 1: Create the JSON Template
- Navigate to the App Workbench
- Click Look and Feel from the App Workbench toolbar
- Click the Templates navigation tab
- Click the + Template button
- Assign a Name for the Template. For example: Gradient
- Change the Content Type value to JSON
- Click Save
-
Enter the appropriate syntax into the Editor (or Source) field. You'll need the start and stop specified colors you want to use for the gradient handy, and can either input these values as hex color code or as rgba. For example:
{ "plotOptions": { "series": { "dataLabels": { "style": { "fontSize": "18px", "fontFamily": "'Roboto', 'Helvetica Neue', Helvetica, Arial, sans-serif" } }, "fillColor": { "linearGradient": { "x1": "0", "x2": "0", "y1": "0", "y2": "1" }, "stops": [ ["0", "rgba(40, 167, 229, 0.3)"], ["1", "rgba(255, 255, 255, 0)"] ] } }, "bar": { "dataLabels": { "style": { "fontSize": "18px", "fontFamily": "'Roboto', 'Helvetica Neue', Helvetica, Arial, sans-serif" } } }, "column": { "dataLabels": { "style": { "fontSize": "18px", "fontFamily": "'Roboto', 'Helvetica Neue', Helvetica, Arial, sans-serif" } } }, "spline": { "dataLabels": { "style": { "fontSize": "18px", "fontFamily": "'Quicksand', 'Helvetica Neue', Helvetica, Arial, sans-serif" } } }, "line": { "dataLabels": { "style": { "fontSize": "18px", "fontFamily": "'Roboto', 'Helvetica Neue', Helvetica, Arial, sans-serif" } } } }, "legend": { "itemStyle": { "fontSize": "18px", "fontFamily": "'Roboto', 'Helvetica Neue', Helvetica, Arial, sans-serif" } }, "series": [ { "dataLabels": { "style": { "fontSize": "18px" } } } ] } -
Click the Save button
Step 2: Connect the JSON Template to the Chart
Now that the JSON Template is created, we can add it to our Chart:
- Navigate to the Chart page where you want to add the gradient fill
- Click on the Action Drawer > Live Designer
- Select the chart
- Click the + Control button from Order Details Controls
- Select JSON Options Object as the Control Type
- Assign a Name. For example: Gradient
- Click the Template drop down menu and select the JSON Template created in Step 1
- Click Next and Finish