Monitor Application
Overview
Currently available on Vinyl Versions 3.1 & 3.2
The Monitor application allows an Administrator to configure notifications for failed jobs that run on a schedule to be sent to User groups. As well as provide a way to document resolutions to failed jobs. It also includes advanced tools for DB maintenance and troubleshooting. If you need an LP file to install this in your environment please open a ticket in the Vinyl Support Portal with your Vinyl Version, minimum version required per major release is:
-
3.1 = 3.1.27769 released on 1/12/2022.
-
3.2 = 3.2.29256 released on 6/23/2022
Post Install Steps
-
Add Service User to Administrator group
-
Navigate to the Monitor App and under Configurations > App Config do the following:
-
Enter Root Server URL (ex.
https://community.zudy.host/Vinyl) -
Enter From Email Address for SMTP
-
Click "Import Users", "Import Schedules", "Import Databases" under the "Configuration Actions" section
-
-
For App Server CPU/Memory utilization tracking, please follow the steps in the Troubleshooting section to give Vinyl permission to access these Windows metric
Notification Configuration
At this point all Schedules and Users should be imported into the application. The next steps will help you setup User Groups for notifications
-
Under Configurations > Users, verify all Users that need to be notified are present
- If Users are missing, then they do not have a User account in this environment. They can be added in the IDE and re-importing users will show them here
-
Under Configurations > User Groups, create Groups and add users to them
-
Under Configurations > Schedule Groups, add groups to schedules to be notified when there is an error on that particular schedule
- You can also add a notification group to a schedule on the Schedule popup page
-
Under Configurations > Notification Templates, make any changes to the default notification template that will be sent in an email
-
On the Home page, select which Schedules you want to be monitored
Database Maintenance Configuration
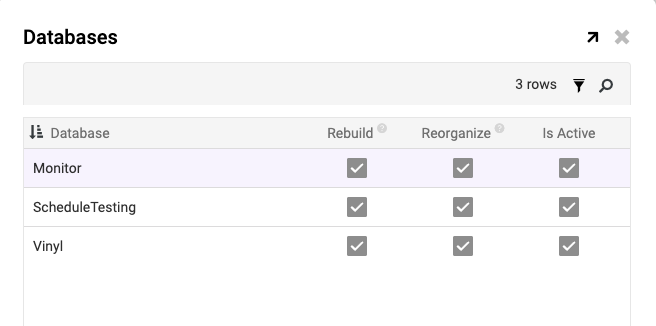
There are 2 schedules (described below) that will rebuild or reorganize indexes for Databases on the DB server. Under Configuration > Databases you can choose which databases are a part of these schedules:
At this point our Home page should look something like this. The Statistics can be turned on/off from the config > statistics menu:
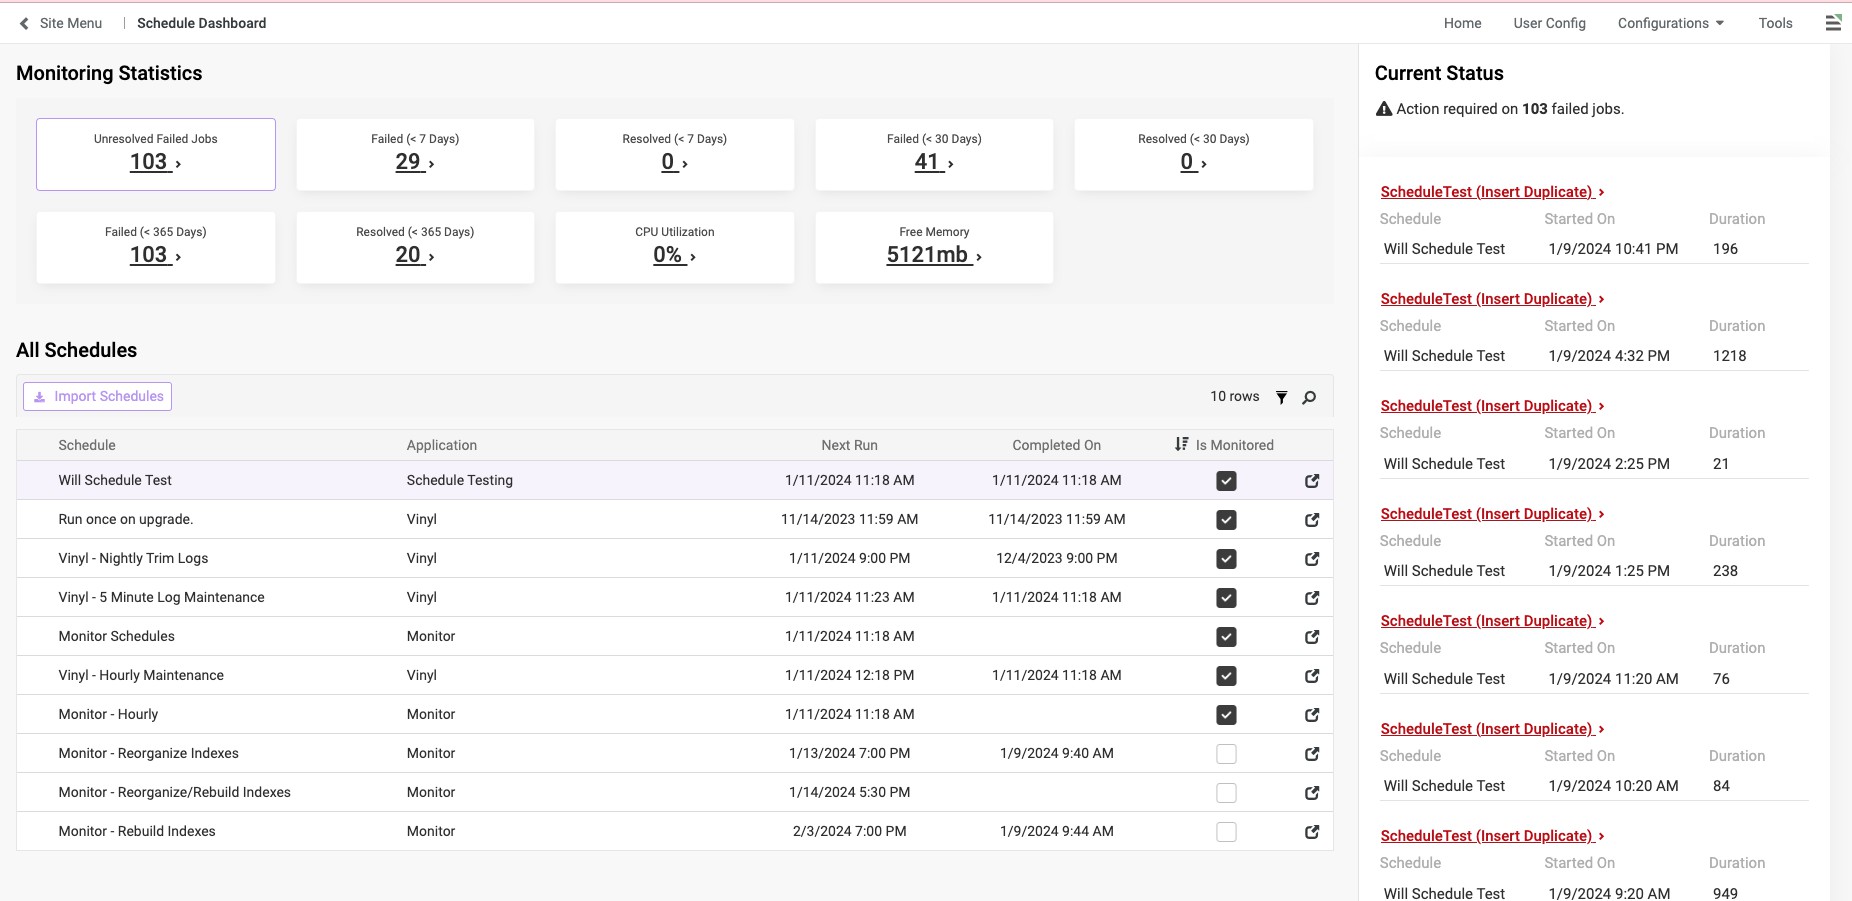
Note
You may not see any failed jobs if there have not been any or the schedule has not run yet.
Home Page
The Home page provides a dashboard view of current statistics of unresolved jobs and server metrics, a view of Schedules that are imported and can be monitored, and a list of unresolved jobs. From the Home page we are able to get to the following pages:
-
Job Details: Displays information about Failed jobs based on a selected filter and its details
-
Schedule Details: Displays information about the Schedule such as configured notification groups and previously failed jobs
-
Performance Metrics History: Displays historical data on App Server CPU/Memory utilization
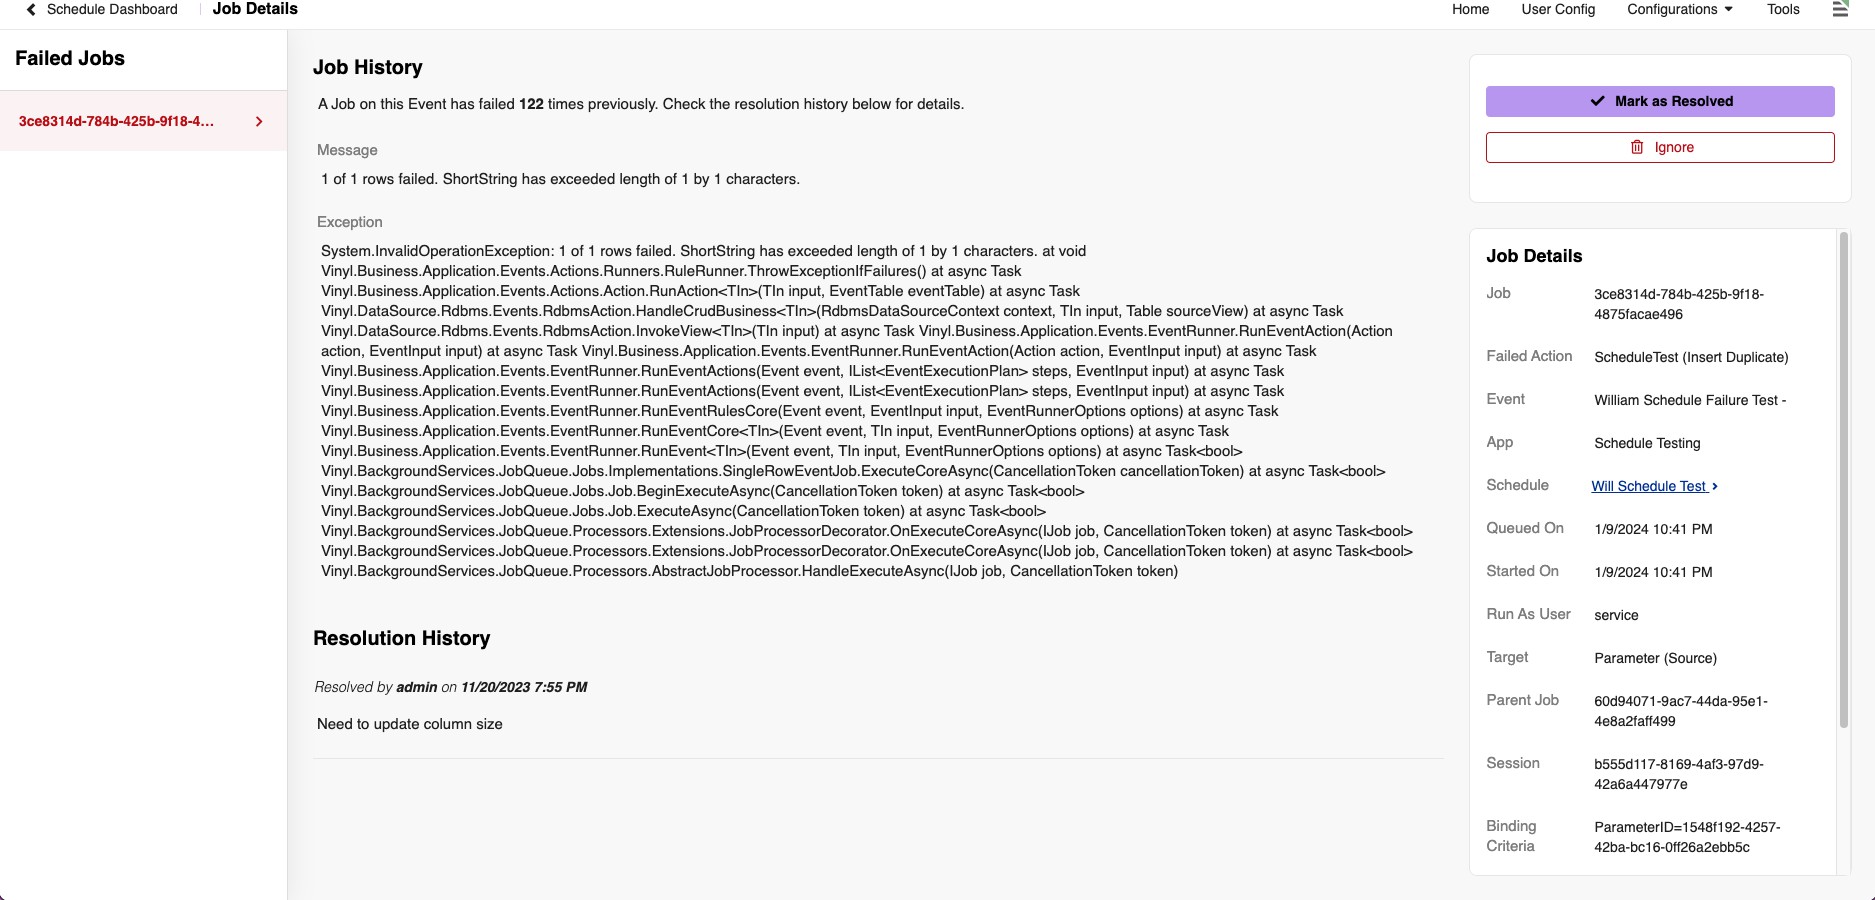
Job Details
The Job Details page displays information about the selected failed job. From here a User can see previous resolution notes (if available) and mark a job as resolved or choose to ignore it. When marking a Job as Resolved we store that record locally to be referenced at a later time. Ignoring a failed Job will delete it permanently.
The Bulk resolve/ignore option allows a user to perform the same action (Resolve or Ignore) on any Failed Jobs that failed on the same Action as the one selected.
Schedules
-
Monitor Schedules: Main schedule required for app to function. Loops through each schedule set to be monitored.
-
Check if schedule has had a failed job in the past 24 hours by checking Sh_Job, Vinyl's internal table to track Jobs
- If yes then CRAM to local job table
-
Update failedActionId from Dg_EventHistory
- failedActionId is not available in sh_job, so we grab it from here instead
-
CRAM any new schedules to local schedules table to allow schedules to be monitored
-
Update last run time for each schedule being monitored
-
-
Monitor App Server Utilization: Schedule to grab App Server CPU/Memory utilization. Runs a custom plugin to grab this data and insert to local table.
Note
In most cases you will need to perform the actions in the Troubleshooting section for this to work properly
-
Monitor Reorganize Indexes: Weekly schedule to run Reorganize Indexes action. Runs the Reorganize Indexes procedure weekly based on the configuration data for the database. There is a flag on each database to include it in this schedule.
-
Monitor Rebuild Indexes: Weekly schedule to run Rebuild Indexes action. Runs the Rebuild Indexes procedure weekly based on the configuration data for the database. There is a flag on each database to include it in this schedule.
Tools
The Toolbar menu includes stored procedures to run against specific databases within the app, as well as corresponding reports. The tabs indicate which database the procedures target and a history of the last time each of the events were run.
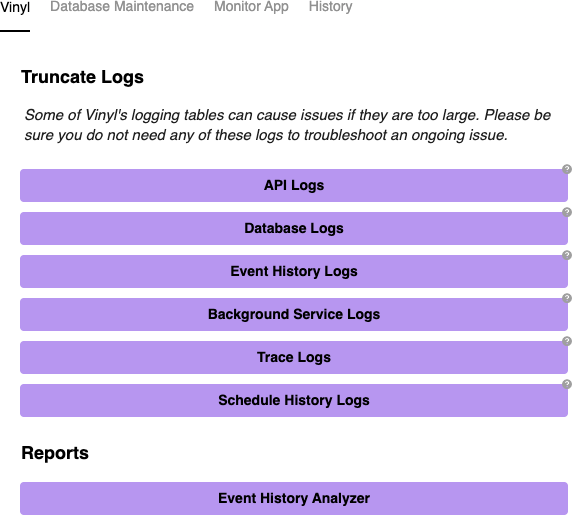
Vinyl:
-
Truncate logs: These actions will delete the table that houses the logs (history) for each specific category.
-
Event History Analyzer:
-
Event Details: Shows a complete list of all events ran including; successes, failures, maximum, minimum, and average durations, and last execution.
-
Event History: Provides a Gantt chart of event execution times, this can be filtered by date (defaults to today's date) and duration (in ms). This is to provide further insight into the events, for example if there was a failure on a specific event you can see from the chart if there was another event running at the same time that could've caused the failure.
-
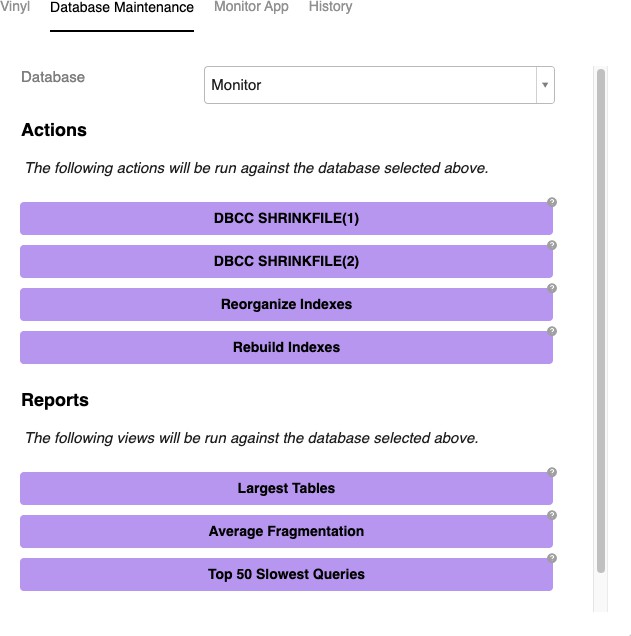
Database Maintenance:
-
Database: This is a dropdown list of all of the databases connected to the monitor app. This allows you to choose which database you want to run the actions/reports against.
-
Actions:
-
Shrinkfile (1): shrinks the data file of the database by reclaiming and compacting free space.
-
Shrinkfile (2): does the same thing but for the log file of the database.
-
Reorganizing Indexes: Defragments the leaf level of clustered and non-clustered indexes on tables and views. This is done by physically reordering the leaf-level pages to match the logical, left to right order of the leaf nodes. This also compacts the index pages.
-
Rebuilding Indexes: Drops and re-creates the index .This includes removing fragmentation, reclaiming disk space by compacting the pages based on the specified or existing fill factor settings, and recording the index rows in contiguous pages.
-
-
Reports: The reports section consists of two views that are run against the database you chose at the top of the page. The first one is the largest tables view, this shows the ten largest tables in the database and sorts them from largest to smallest. The report includes used MB and allocated MB. The second report is average fragmentation of all of the tables in the database. This contains the schema, average fragmentation percentage, index, and page count. The report that runs across all databases is the top 50 slowest queries view. This shows execution count, logical reads/writes, worker time, elapsed time, last execution date, and the query plan.
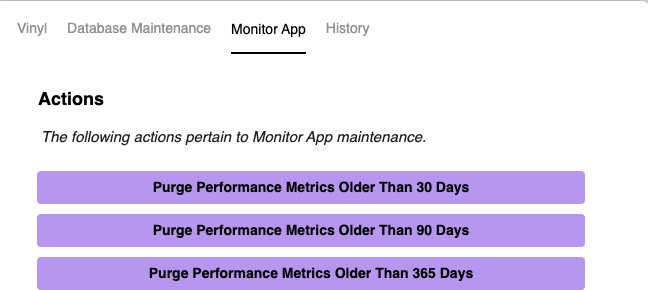
Monitor App:
- Actions: There are three actions for the monitor application. They purge the Performance metrics for different periods of time. This means that it clears out all records within that time period.
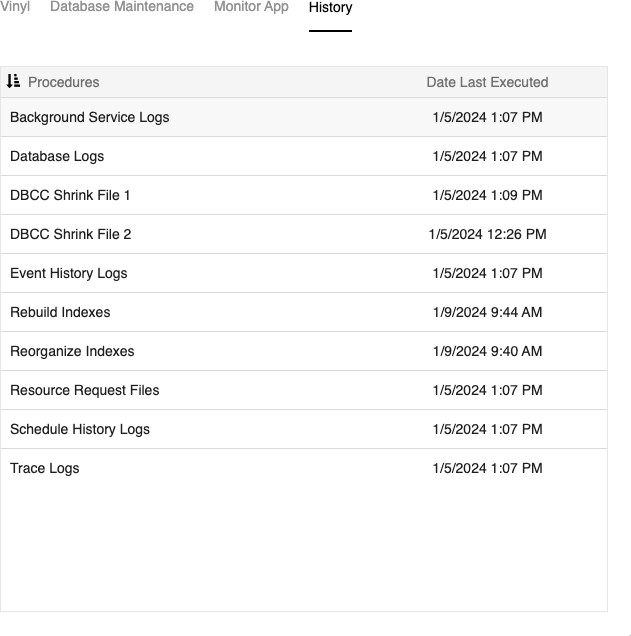
History:
This panel shows the last execution date of all the database procedures, but not the reports.
Troubleshooting:
-
Potential errors: When running the performance metrics for your application you may receive the following error: "Access to the registry key 'Global' is denied". To fix this issue you must perform the following steps:
-
Open "Computer management" > "Local Users and Groups" > "Groups" > "Performance Monitor Users" > Now 'Add' the application pool user account (example: IIS AppPool\DefaultAppPool)
-
Do the above step for Performance Log Users as well
-
Restart IIS
-