Network Graph
Network Graphs have many different business use cases, including showing relationships between companies, people, or products. A Network Graph helps visualize how things are interconnected with each other, where entities are displayed as nodes and relationships between them are displayed with lines.
A User can interact with the Network Graph using the tools in the lower right corner and also by dragging within the panel itself. The Network Graph can be saved outside of Vinyl by right mouse clicking on top of the diagram, and choosing Save Image as.... This will place an image file to the location you direct.
The configuration for a Network Graph is similar to other Chart types in Vinyl, and relies on an associated Business Object that contains the information being displayed on the chart itself. The Business Object is essentially a list of links the Network Graph will display, where the Node Control is the node itself, and the From Control is the node it's connected to. Here is an example Network Graph illustration, along with the associated Business Object used to generate the chart:
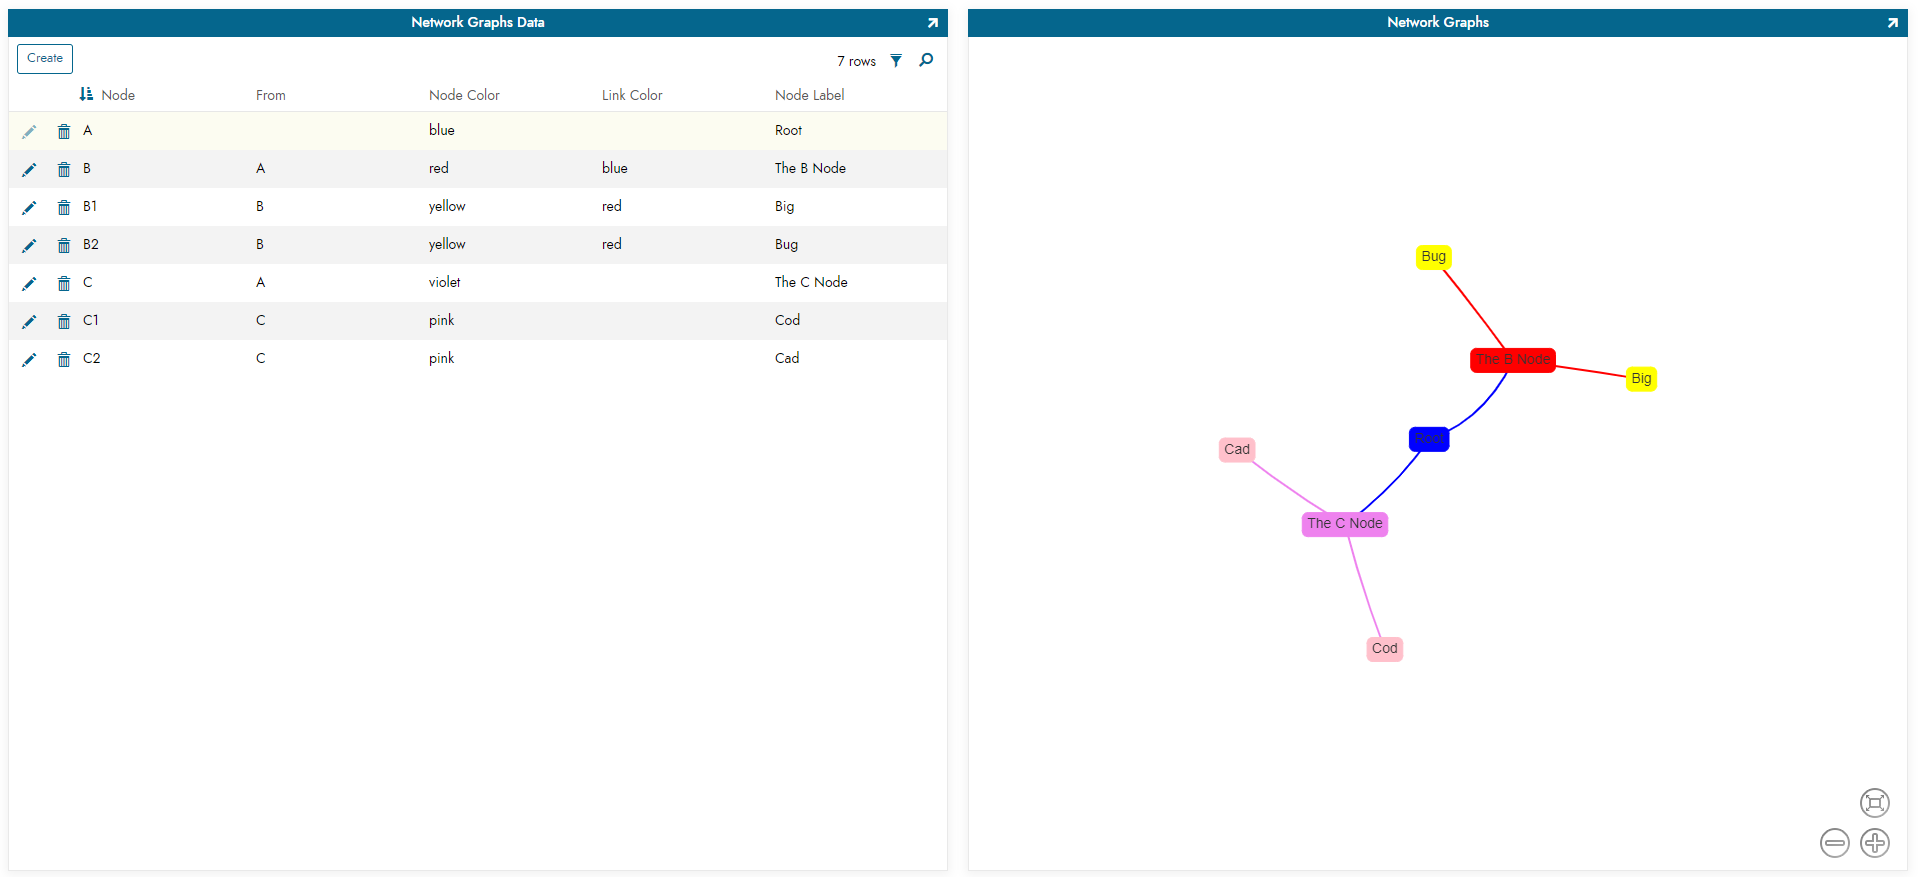
Chart Configuration
The Network Graph supports the following Control Types:
- Node: The Node itself. Required field.
- From: Represents the Node a Node connects to. Required field.
- Color: Color of the Node
- Node Label: Optionally used if you want to provide a different label for the Node itself. The Node values need to be unique for the Chart to work whereas the Label value can be whatever you want.
- JSON Option Objects: JSON object which overrides chart options. Used for control over default chart styling.
- Link Color: Color of the link
How to Add a Network Graph
- Go to Action Drawer > Live Designer
- Click + Add Panel
- Select Network Graph > Select Type
- Select the Panel source. For example: NetworkGraph (Source)
- Click Create Panel
- Click Controls > + Control
- Select the Control Type Node
- Select the Column that maps to node value. For example: Node
- Click Save
- Select + Control
- Select the Control Type From
- Select the Column that maps to node value. For example: From
- Click Save
- View the Chart and determine if you want to add any additional configuration or styling