How to Create a Stacked Area Chart
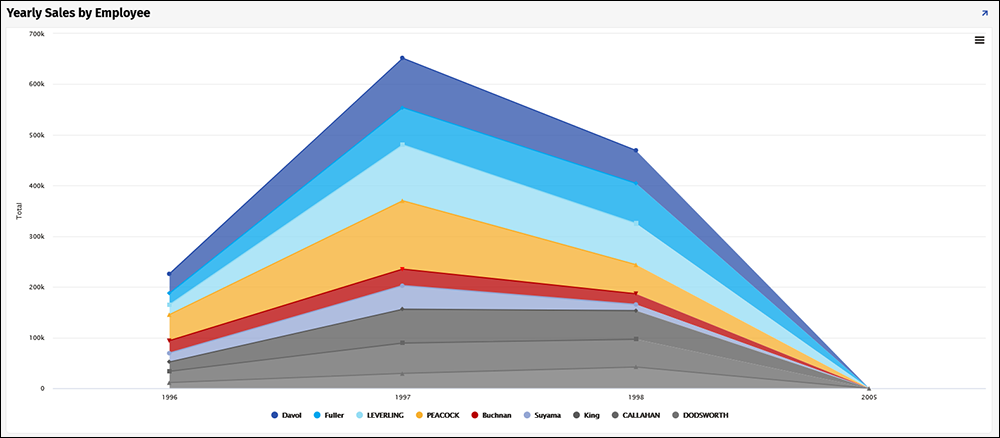
Stacked Area charts are a new feature available in Vinyl 3.3. A Stacked Area chart is an extension of a basic Area chart. Sometimes referred to as a Mountain chart, a Stacked Area chart adds together the data series values to make up a total. Use this chart type when you want to track total value as well as understand the breakdown of total by groups.
Requirements
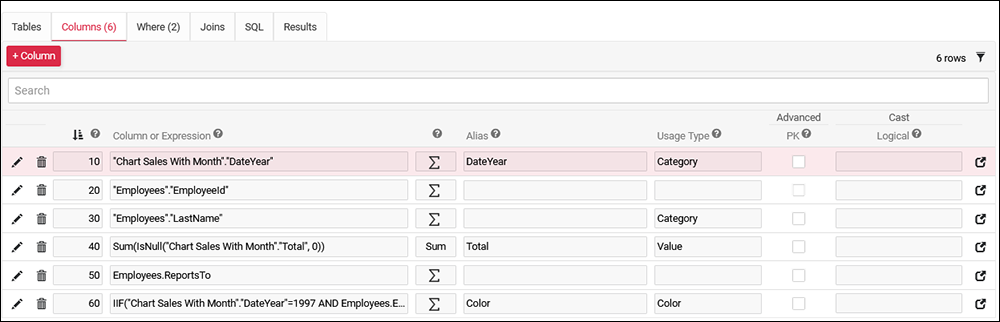
A Stacked Area chart requires at least 2 Controls defined to display properly, one for the Category and one for the Value. Additional Controls may be defined if you are specifying Color, Sort, Chart Flag, and/or JSON Options Object.
The first step to creating any chart in Vinyl is to have a Business Object that contains the data you want to display. The Business Logic is where you define what data maps to the Category, Value, and any additional controls you wish to define.
How to Configure a Stacked Area Chart
- From the app view, go to Action Drawer > App Workbench
- Click the + Page button
- Enter a Page Name. For example: Yearly Sales by Employee
- Click Next
- Choose a Menu to link to the new page from. For example: Reports
- Click Next
- Select the panel layout. For example: Full Page
- Click Next
- Review the information on how Vinyl will build the page, and click Finish
- Click the Proceed button
- Select Chart from the Report options
- Click Next
- Select an existing Business Object with the underlying data (if one already exists), or click + New Source if one needs to be created
- Click Next
- Review the information on how Vinyl will build the panel, and click Finish
- Go to the Action Drawer > Live Designer
- Select the chart panel from the app view
- Change the Chart Type to be Stacked Area
- Click Save
- Exit out of the edit panel and confirm the chart displays as intended